
1/ Another “hit piece” by the mask and lockdown narrative.
Reading the dogmatic “masks work”, Sweden wrong introduction is already enlightening:
“Ignored…that face masks protect both the carrier and others.”
“authority lacked expertise and could disregard scientific facts.”
Reading the dogmatic “masks work”, Sweden wrong introduction is already enlightening:
“Ignored…that face masks protect both the carrier and others.”
“authority lacked expertise and could disregard scientific facts.”
https://twitter.com/gidmk/status/1507617401177010184

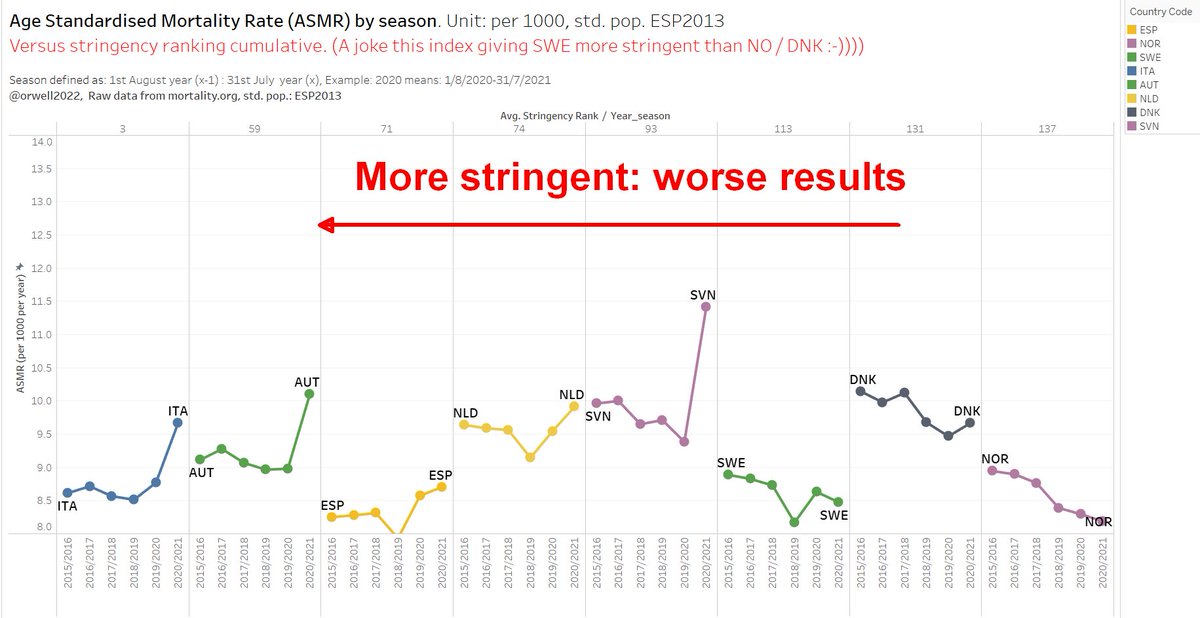
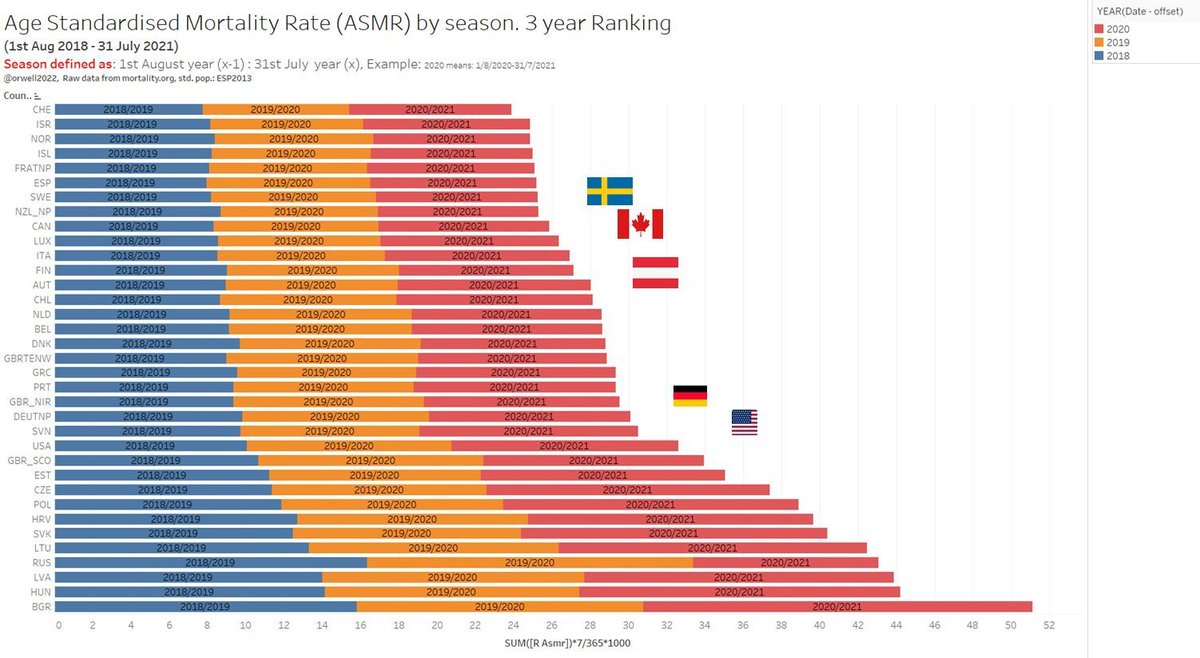
2/ Sweden correctly labeled the response of radical countries as extreme.
The data shows the failed approach and collateral damage clearly.
The evidence is bad, so what to do? Double down on Sweden (best in Nature) although having disastrous results in lockdown countries.
The data shows the failed approach and collateral damage clearly.
The evidence is bad, so what to do? Double down on Sweden (best in Nature) although having disastrous results in lockdown countries.
https://twitter.com/orwell2022/status/1506273831543099404
3/ And never question the true and only total lockdown approach including child masking by Dr. Fauci and other “nerds”.
The results have shown the superior performance?
The results have shown the superior performance?

4/ The entire paper is a grievance piece. I got the impression like reading #NoCovid propaganda.
Obviously some Swedish lockdown fans are jealous/angry for not having achieved taking power over the country and shutting it down.
So I looked up the author…
Obviously some Swedish lockdown fans are jealous/angry for not having achieved taking power over the country and shutting it down.
So I looked up the author…

5/ What a timeline.
Is @NeleBrusselaers the Swedish version of @BrinkmannLab ?
God thanks that our Swedish system and law is set up to be resilient agains such snake oil fear mongers who in other countries took over the society with “the science TM”.
Move to Germany Nele.
Is @NeleBrusselaers the Swedish version of @BrinkmannLab ?
God thanks that our Swedish system and law is set up to be resilient agains such snake oil fear mongers who in other countries took over the society with “the science TM”.
Move to Germany Nele.

6/ @NeleBrusselaers further complains about "the lack of solidarity in the society".
She is angry that police couldn't lockdown and beat the citizens. Kids weren't allowed to be scared, masked, closed up she complains.
She wanted this "solidarity"?
She is angry that police couldn't lockdown and beat the citizens. Kids weren't allowed to be scared, masked, closed up she complains.
She wanted this "solidarity"?


7/ She complains that Sweden didn't follow the WHO and "the science" (not closing like recommended).
Who shall science be? Her? Fauci? Lauterbach? Brinkmann? CCP? Director of WHO (a former communist)?
No word about the failure of those who did.
Who shall science be? Her? Fauci? Lauterbach? Brinkmann? CCP? Director of WHO (a former communist)?
No word about the failure of those who did.


8/ I congratulate @NeleBrusselaers for this "science" paper.
She is joining the shame level of this @Nature article where anti terror forces are recommended agains "Covid deniers" (yes, she uses that word in the paper to judge Sweden).
nature.com/articles/d4158…
She is joining the shame level of this @Nature article where anti terror forces are recommended agains "Covid deniers" (yes, she uses that word in the paper to judge Sweden).
nature.com/articles/d4158…
• • •
Missing some Tweet in this thread? You can try to
force a refresh


