1/
Get a cup of coffee.
In this thread, I'll walk you through the key elements of a Cockroach Portfolio.
As investors, we want our portfolios to produce reasonable returns without major drawdowns.
Here are some key concepts to help you *construct* such portfolios: 👇
Get a cup of coffee.
In this thread, I'll walk you through the key elements of a Cockroach Portfolio.
As investors, we want our portfolios to produce reasonable returns without major drawdowns.
Here are some key concepts to help you *construct* such portfolios: 👇

2/
Imagine we have a company: ABC, Inc.
ABC's stock trades on the NASDAQ (ticker: $ABC).
Most years, this stock grows 10%, reflecting growing revenues and profits at the company.
But from time to time (say, once every 10 years), there's a big drawdown. The stock crashes 50%.
Imagine we have a company: ABC, Inc.
ABC's stock trades on the NASDAQ (ticker: $ABC).
Most years, this stock grows 10%, reflecting growing revenues and profits at the company.
But from time to time (say, once every 10 years), there's a big drawdown. The stock crashes 50%.
3/
Of course, there's no way to predict in advance *when* such drawdowns will occur.
So, in any one year, the stock's return is essentially a "random variable" independent of all previous years -- with:
90% chance of a +10% return, and
10% chance of a *negative* 50% return.
Of course, there's no way to predict in advance *when* such drawdowns will occur.
So, in any one year, the stock's return is essentially a "random variable" independent of all previous years -- with:
90% chance of a +10% return, and
10% chance of a *negative* 50% return.
4/
Suppose we buy and hold $ABC stock for 10 years.
What's our most likely return (CAGR) during this period?
Well, the most likely scenario is: 9 "up" years and 1 "down" year.
The "up" years each get us +10%.
BUT the "down" year brings our overall CAGR down to just +1.66%.
Suppose we buy and hold $ABC stock for 10 years.
What's our most likely return (CAGR) during this period?
Well, the most likely scenario is: 9 "up" years and 1 "down" year.
The "up" years each get us +10%.
BUT the "down" year brings our overall CAGR down to just +1.66%.

5/
Over 10 years, a ~1.66%/yr CAGR is pretty anemic.
But it's NOT unrealistic.
"Lost decades" are very much a feature of stock markets.
For example, from ~2000 to ~2010, the S&P 500 returned close to nothing.
As investors, we should prepare ourselves for such outcomes.
Over 10 years, a ~1.66%/yr CAGR is pretty anemic.
But it's NOT unrealistic.
"Lost decades" are very much a feature of stock markets.
For example, from ~2000 to ~2010, the S&P 500 returned close to nothing.
As investors, we should prepare ourselves for such outcomes.

6/
Thus, big drawdowns can lead to lost decades.
So, how do we *avoid* such big drawdowns? Or at least, reduce their impact on our portfolio?
One approach is to hold a fraction of our portfolio in cash -- and re-balance our portfolio regularly between stocks and cash.
Thus, big drawdowns can lead to lost decades.
So, how do we *avoid* such big drawdowns? Or at least, reduce their impact on our portfolio?
One approach is to hold a fraction of our portfolio in cash -- and re-balance our portfolio regularly between stocks and cash.
7/
This way, when we have good years and our stocks rise, we pull some money *out* of stocks and *add* to our cash pile.
And when there's a big drawdown, we use part of this cash pile to pick up some stocks on the cheap.
Over the long haul, this can help improve our returns.
This way, when we have good years and our stocks rise, we pull some money *out* of stocks and *add* to our cash pile.
And when there's a big drawdown, we use part of this cash pile to pick up some stocks on the cheap.
Over the long haul, this can help improve our returns.
8/
So, what's the optimal amount of cash to hold in our portfolio? 10% of the portfolio? 20%? 30%?
If we know the odds of a drawdown and how big it can be, the Kelly Criterion can help us figure out how much cash to keep.
For more:
So, what's the optimal amount of cash to hold in our portfolio? 10% of the portfolio? 20%? 30%?
If we know the odds of a drawdown and how big it can be, the Kelly Criterion can help us figure out how much cash to keep.
For more:
https://twitter.com/10kdiver/status/1264622958468726785
9/
For example, our $ABC stock has a 10% chance of a 50% drawdown. And the other 90% of the time, the stock grows 10% per year.
Plugging these assumptions into the Kelly Criterion, we find that the *optimal* portfolio is 20% cash and 80% $ABC stock.
Calculations:
For example, our $ABC stock has a 10% chance of a 50% drawdown. And the other 90% of the time, the stock grows 10% per year.
Plugging these assumptions into the Kelly Criterion, we find that the *optimal* portfolio is 20% cash and 80% $ABC stock.
Calculations:


10/
So, when $ABC stock is 100% of our portfolio, our long-run CAGR is ~1.66%.
How much does this CAGR increase if we follow the Kelly Criterion -- ie, 80% $ABC stock, 20% cash, and annual re-balancing to stay that way?
Well, this improves our CAGR from ~1.66% to ~1.83%.
So, when $ABC stock is 100% of our portfolio, our long-run CAGR is ~1.66%.
How much does this CAGR increase if we follow the Kelly Criterion -- ie, 80% $ABC stock, 20% cash, and annual re-balancing to stay that way?
Well, this improves our CAGR from ~1.66% to ~1.83%.

11/
All that fancy math and effort -- for a measly 0.17%.
Where's the justice in this universe?
And furthermore, Kelly tells us that this portfolio is *optimal*.
So, NO other "cash + $ABC + re-balancing" portfolio can beat this ~1.83%/yr either.
All that fancy math and effort -- for a measly 0.17%.
Where's the justice in this universe?
And furthermore, Kelly tells us that this portfolio is *optimal*.
So, NO other "cash + $ABC + re-balancing" portfolio can beat this ~1.83%/yr either.
12/
So, IF we want to escape the effect of a big drawdown, our portfolio cannot have just cash and $ABC stock in it.
We need a new asset.
And this asset can come from a rather unlikely place.
So, IF we want to escape the effect of a big drawdown, our portfolio cannot have just cash and $ABC stock in it.
We need a new asset.
And this asset can come from a rather unlikely place.
13/
Suppose we have a second stock, $XYZ.
Unlike $ABC (which goes *up* most years), $XYZ goes *down* most years. And not by a small amount either -- but by 25%.
*Occasionally* though (about once in 10 years), $XYZ does super well. It 10-Xs -- ie, goes up +900%.
Suppose we have a second stock, $XYZ.
Unlike $ABC (which goes *up* most years), $XYZ goes *down* most years. And not by a small amount either -- but by 25%.
*Occasionally* though (about once in 10 years), $XYZ does super well. It 10-Xs -- ie, goes up +900%.
14/
$XYZ, it turns out, is a much *worse* stock to buy and hold than $ABC.
With $ABC, we at least get a *positive* return: ~1.66% per year.
But if we buy and hold $XYZ, we end up with a *negative* ~2.82% long-run CAGR.
One 10-X does NOT make up for nine 25% drops.
$XYZ, it turns out, is a much *worse* stock to buy and hold than $ABC.
With $ABC, we at least get a *positive* return: ~1.66% per year.
But if we buy and hold $XYZ, we end up with a *negative* ~2.82% long-run CAGR.
One 10-X does NOT make up for nine 25% drops.

15/
So, over the long run, $XYZ LOSES money.
Why even bother with $XYZ then?
Because it has one redeeming feature: it's *negatively correlated* with $ABC.
Remember the 1 year out of 10 when $ABC experiences a 50% drawdown? That happens to be the year $XYZ 10-Xs.
So, over the long run, $XYZ LOSES money.
Why even bother with $XYZ then?
Because it has one redeeming feature: it's *negatively correlated* with $ABC.
Remember the 1 year out of 10 when $ABC experiences a 50% drawdown? That happens to be the year $XYZ 10-Xs.
16/
We can take advantage of this negative correlation.
How? We build a portfolio containing *both* $ABC and $XYZ.
9 out of 10 years, the $ABC part of the portfolio grows 10%. And the $XYZ part shrinks 25%.
When that happens, we sell some $ABC to buy *more* of the LOSER $XYZ.
We can take advantage of this negative correlation.
How? We build a portfolio containing *both* $ABC and $XYZ.
9 out of 10 years, the $ABC part of the portfolio grows 10%. And the $XYZ part shrinks 25%.
When that happens, we sell some $ABC to buy *more* of the LOSER $XYZ.
17/
But 1 year out of 10, $ABC will experience a 50% drawdown.
That same year, $XYZ will 10-X.
And that's when we sell part of our $XYZ holdings to buy $ABC on the cheap.
Negative correlation + Re-balancing is a powerful combination.
But 1 year out of 10, $ABC will experience a 50% drawdown.
That same year, $XYZ will 10-X.
And that's when we sell part of our $XYZ holdings to buy $ABC on the cheap.
Negative correlation + Re-balancing is a powerful combination.
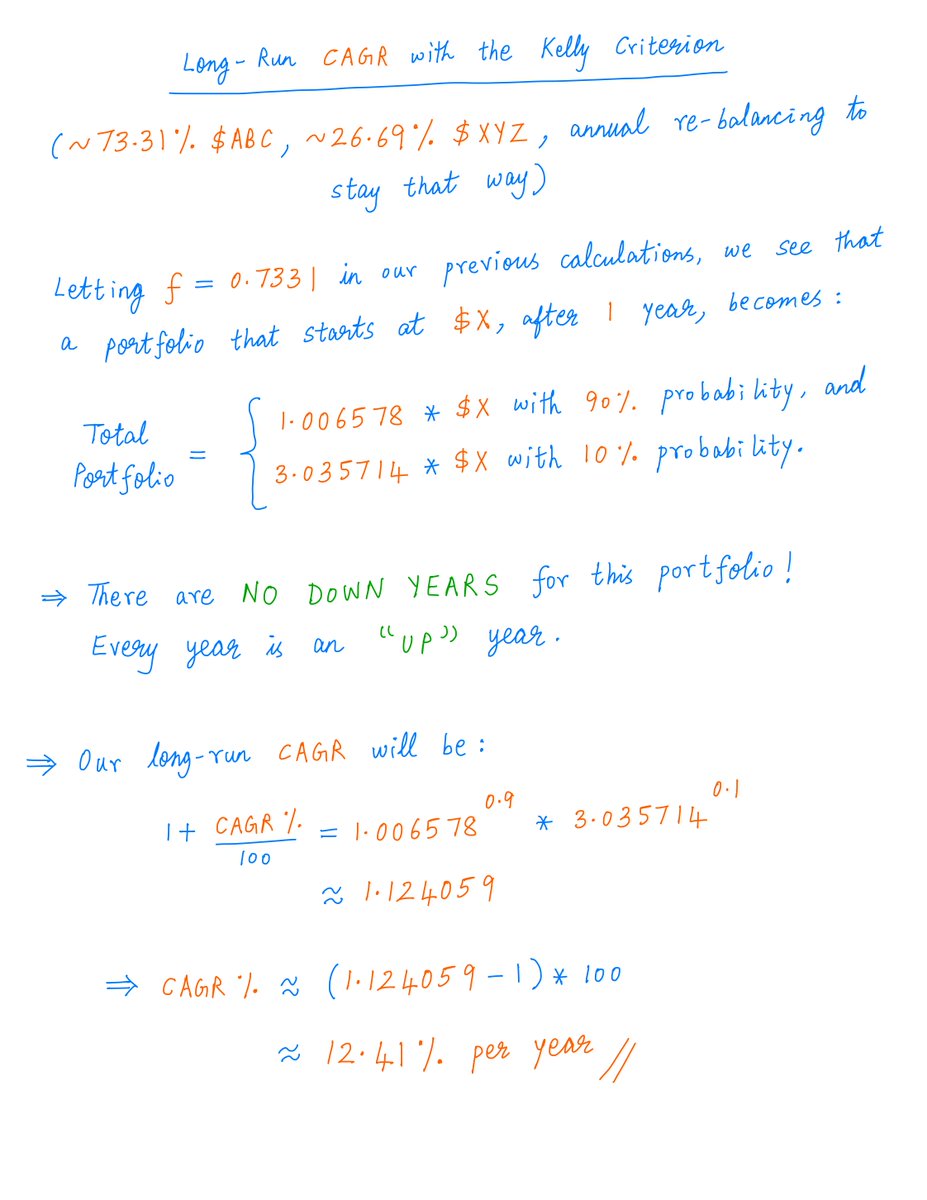
18/
The Kelly Criterion again helps us work out the optimal split between $ABC and $XYZ.
It turns out to be: ~73.31% $ABC and ~26.69% $XYZ.
And this optimal portfolio achieves a ~12.41% per year long-run CAGR -- with NO drawdowns in ANY year!
The Kelly Criterion again helps us work out the optimal split between $ABC and $XYZ.
It turns out to be: ~73.31% $ABC and ~26.69% $XYZ.
And this optimal portfolio achieves a ~12.41% per year long-run CAGR -- with NO drawdowns in ANY year!


19/
So, we have:
Just $ABC: ~1.66% CAGR, 50% drawdown,
Just $XYZ: *negative* ~2.82% CAGR, 25% drawdown,
$ABC + Cash: ~1.83% CAGR, 40% drawdown, and
$ABC + $XYZ: ~12.41% CAGR, NO drawdown.
That's the power of negative correlations and re-balancing.
So, we have:
Just $ABC: ~1.66% CAGR, 50% drawdown,
Just $XYZ: *negative* ~2.82% CAGR, 25% drawdown,
$ABC + Cash: ~1.83% CAGR, 40% drawdown, and
$ABC + $XYZ: ~12.41% CAGR, NO drawdown.
That's the power of negative correlations and re-balancing.
20/
Of course, in the real world, stocks produce a range of returns -- not just +x% or -y%.
And the probabilities of these returns are not known so precisely.
And perfect negative correlations are hard to find.
So, our example wasn't super-realistic.
Of course, in the real world, stocks produce a range of returns -- not just +x% or -y%.
And the probabilities of these returns are not known so precisely.
And perfect negative correlations are hard to find.
So, our example wasn't super-realistic.
21/
Still, there are some broad lessons we can take away from this exercise.
First, we should look at investments from a "portfolio" perspective.
*Standalone*, a bet may have negative CAGR. But it may still add much value to a *portfolio* of other bets (eg, our $XYZ stock).
Still, there are some broad lessons we can take away from this exercise.
First, we should look at investments from a "portfolio" perspective.
*Standalone*, a bet may have negative CAGR. But it may still add much value to a *portfolio* of other bets (eg, our $XYZ stock).
22/
Second, negatively correlations provide powerful diversification.
We can't usually predict the future.
But with negative correlations, we *can* construct our portfolio so that: no matter how the future plays out, there are almost always *some* bets that are paying off.
Second, negatively correlations provide powerful diversification.
We can't usually predict the future.
But with negative correlations, we *can* construct our portfolio so that: no matter how the future plays out, there are almost always *some* bets that are paying off.
23/
The bets that are paying off provide liquidity and minimize portfolio level drawdowns.
This can give us opportunities to rotate out of them and re-balance into other assets on the cheap.
If we do this successfully, we can meaningfully improve our portfolio's performance.
The bets that are paying off provide liquidity and minimize portfolio level drawdowns.
This can give us opportunities to rotate out of them and re-balance into other assets on the cheap.
If we do this successfully, we can meaningfully improve our portfolio's performance.
24/
A financial advisor named Harry Browne popularized these ideas in the 1970s.
Browne suggested that investors construct their portfolios in a "future agnostic" way.
Whether the future brings growth or recession, inflation or deflation, the portfolio should still perform:
A financial advisor named Harry Browne popularized these ideas in the 1970s.
Browne suggested that investors construct their portfolios in a "future agnostic" way.
Whether the future brings growth or recession, inflation or deflation, the portfolio should still perform:

25/
Several well-known investors were inspired by Browne.
They developed Browne's ideas further and added their own unique spins.
For example, @RayDalio with his All Weather Portfolio, @MebFaber with his Trinity Portfolio, Mark Spitznagel with his Tail Hedging strategies, etc.
Several well-known investors were inspired by Browne.
They developed Browne's ideas further and added their own unique spins.
For example, @RayDalio with his All Weather Portfolio, @MebFaber with his Trinity Portfolio, Mark Spitznagel with his Tail Hedging strategies, etc.
26/
My friend @TaylorPearsonMe and his colleague @JasonMutiny have also modeled their investment philosophy along similar lines.
Their approach is to generate negative correlations via "volatility" strategies (eg, VIX futures).
They call this the Cockroach Portfolio.
My friend @TaylorPearsonMe and his colleague @JasonMutiny have also modeled their investment philosophy along similar lines.
Their approach is to generate negative correlations via "volatility" strategies (eg, VIX futures).
They call this the Cockroach Portfolio.
27/
These "negative correlation" techniques are super fun, and the core concepts behind them can be useful to investors of all stripes.
To learn more, please join @TaylorPearsonMe, @JasonMutiny, and me tomorrow (Sun, Mar 27) at 1pm ET on Money Concepts:
callin.com/link/JRNgYvcoDC
These "negative correlation" techniques are super fun, and the core concepts behind them can be useful to investors of all stripes.
To learn more, please join @TaylorPearsonMe, @JasonMutiny, and me tomorrow (Sun, Mar 27) at 1pm ET on Money Concepts:
callin.com/link/JRNgYvcoDC
28/
About Money Concepts
We're a virtual investing club. Our goal is to help each other become better investors.
We meet Sundays at 1pm ET via @getcallin, to discuss all things investing.
Join us. Get the app. Subscribe. Tell your friends.
It's FREE.
callin.com/show/money-con…
About Money Concepts
We're a virtual investing club. Our goal is to help each other become better investors.
We meet Sundays at 1pm ET via @getcallin, to discuss all things investing.
Join us. Get the app. Subscribe. Tell your friends.
It's FREE.
callin.com/show/money-con…
29/
With wars going on, geopolitical tensions, fears about inflation, etc., it is super important to make our portfolios robust and resilient.
I hope the ideas in this thread gave you some insights into this.
Please stay safe. Enjoy your weekend!
/End
With wars going on, geopolitical tensions, fears about inflation, etc., it is super important to make our portfolios robust and resilient.
I hope the ideas in this thread gave you some insights into this.
Please stay safe. Enjoy your weekend!
/End
• • •
Missing some Tweet in this thread? You can try to
force a refresh