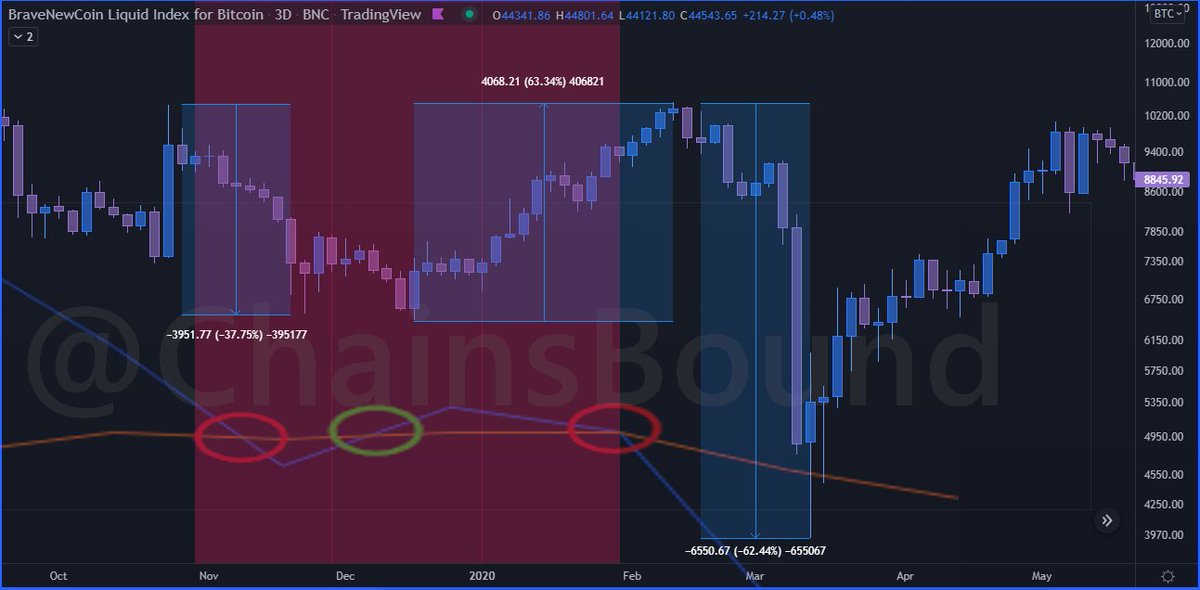
Due to the current apparent contradiction between some of the higher timeframes, I decided to do a study on MAC-D crosses throughout #Bitcoin's history using the Brave New Coin liquid index $BNC for $BTC 🤓
Hope someone else finds it useful as well. 🦾💕🧵
Hope someone else finds it useful as well. 🦾💕🧵

Since the current MAC-D cross that has most people worried -as it's opposing most of its lower periods- is the monthly, let's focus on that timeframe first. 

All previous downward monthly MAC-D crosses happened around the middle of bear markets and were followed by bull traps before resuming the downtrend. 

Only monthly conflicting conglomeration (cross down, cross up, cross down) was the bull trap at the end of 2019 bear market before the black swan, which actually followed the monthly MAC-D crossing down on February 1st. 

This seemingly rapid succession signified violent moves of 38% down, 63% up, and 62% down respectively as we can see more clearly on a lower timeframe chart (measured from cross occurrence to the following high/low). 

Previous monthly crosses signaled strong downwards movements as well, with an over 60% drop following Jun 2018 cross, and a over 70% following the one on August 2014. 

Not so much can be said about the weekly ones, which although quite frequently point out the current or immediately following trend, are more prone to conflicting signals and tend to take part in price action fake-outs. 

On the last occurrence of the three #MACD crosses happening sequentially at the end of 2020, there was a 29% price decrease measured from the weekly cross, 35% from the bi-weekly (after the bull-trap), and 33% from the monthly. The total downward move was of 53,5% on $BTC price. 

From last downwards monthly cross there was a 32% drop, 45% from the simultaneous downward bi-weekly and weekly crosses preceding it, and +-52% from the previous top (ATH).
Might that be it? It might.
Let's see how the weekly and monthly closes in just a couple days😉🦾#Bitcoin
Might that be it? It might.
Let's see how the weekly and monthly closes in just a couple days😉🦾#Bitcoin

@threadreaderapp
unroll
👇👍
unroll
👇👍
• • •
Missing some Tweet in this thread? You can try to
force a refresh


