@WifeyAlpha recently posted a thread with 16 buy-and-hold asset allocation schemes, i.e. fixed-weight portfolios that can be implemented with ETFs. I decided to write some code to test these in #R #RStats. The code is available on #RPubs:
rpubs.com/arubesam/stati…
rpubs.com/arubesam/stati…
The code is a quick & dirty calculation using monthly returns with monthly rebal. It does not take into account transaction costs. The code can be easily adapted to test other asset allocation schemes.
I use the following #R packages: quantmod to get prices from Yahoo; PerformanceAnalytics for calculation of performance metrics. All backtests start when data for all necessary tickers becomes available.
First, the portfolios:
1. Golden Butterfly: SHY(20%), TLT (20%), VTI (20%), IWN (20%), GLD (20%)
2. Rob Arnott Portfolio: BNDX (20%), LQD (20%), VEU (10%), VNQ (10%), SPY (10%), TLT (10%), TIP (10%), DBC(10%)
1. Golden Butterfly: SHY(20%), TLT (20%), VTI (20%), IWN (20%), GLD (20%)
2. Rob Arnott Portfolio: BNDX (20%), LQD (20%), VEU (10%), VNQ (10%), SPY (10%), TLT (10%), TIP (10%), DBC(10%)
3. Global Asset Allocation Portfolio: SPY (18%), EFA (13.5%), EEM (4.5%), LQD (19.8%) , BNDX (14.4%), TLT (13.5%), TIP (1.8%), DBC (5%), GLD (5%), VNQ (4.5% )
4. Permanent Portfolio: BIL (25%), GLD(25%), TLT (25%), SPY (25%)
5. Desert Portfolio: IEF (60%), VTI(30%), GLD(10%)
4. Permanent Portfolio: BIL (25%), GLD(25%), TLT (25%), SPY (25%)
5. Desert Portfolio: IEF (60%), VTI(30%), GLD(10%)
6. The Larry Portfolio: IWN (15%), DLS (7.5%), EEM (7.5%), IEF (70%)
7. Big Rocks Portfolio: AGG (60%), SPY (6%), IWD (6%), IWM (6%), IWN (6%), EFV (4%), VNQ (4%), EFA (2%), SCZ (2%), DLS (2%), EEM (2%)
7. Big Rocks Portfolio: AGG (60%), SPY (6%), IWD (6%), IWM (6%), IWN (6%), EFV (4%), VNQ (4%), EFA (2%), SCZ (2%), DLS (2%), EEM (2%)
8. Sandwich Portfolio: IEF (4.1%), SPY (2%), SCZ (10%), IWM (8%), EEM (6%), EFA (6%), VNQ (5%), BIL (4%)
9. Balanced - Tax Aware Portfolio: AGG (38%), SPY (15%), BIL (15%), EFA (13%), IWM (5%), VNQ (5%), DBC (5%), EEM (4%)
9. Balanced - Tax Aware Portfolio: AGG (38%), SPY (15%), BIL (15%), EFA (13%), IWM (5%), VNQ (5%), DBC (5%), EEM (4%)
10. Balanced Portfolio: AGG (33%), SPY (15%), BIL (15%), EFA (13%), IWM (5%), VNQ (5%), DBC (5%), EEM (4%), TIP (2%), BNDX (2%), HYG (1%)
11. Income With Growth Portfolio: AGG (37%), BIL (20%), TIP (10%), SPY (9%), EFA (8%), VNQ (5%), HYG (4%), BNDX (4%), IWM (2%), DBC (1%)
11. Income With Growth Portfolio: AGG (37%), BIL (20%), TIP (10%), SPY (9%), EFA (8%), VNQ (5%), HYG (4%), BNDX (4%), IWM (2%), DBC (1%)
12. Income Growth Tax Portfolio: AGG (55%), BIL (20%), SPY (9%), EFA (8%), VNQ (5%), IWM (2%), DBC (1%)
13. Conservative Income Portfolio: AGG (40%), BIL (25%), TIP (18%), HYG (7%), VNQ (5%), BNDX (5%)
14. Conservative Income Tax Portfolio: AGG (70%), BIL (25%), VNQ (5%)
13. Conservative Income Portfolio: AGG (40%), BIL (25%), TIP (18%), HYG (7%), VNQ (5%), BNDX (5%)
14. Conservative Income Tax Portfolio: AGG (70%), BIL (25%), VNQ (5%)
15. All Weather Portfolio: SPY (30%), TLT (40%), IEF (15%), GLD (7.5%), DBC (7.5%)
16. United Stated 60/40 Portfolio: SPY (60%), IEF (40%)
16. United Stated 60/40 Portfolio: SPY (60%), IEF (40%)
Main results are close to those reported by @WifeyAlpha, with exception of some max DDs, due to the fact that some ETFs are only available after 2008. The ann. returns range from 2.63% for Conservative Income to 8.15% for the US 60/40 strategy. 

The Desert portfolio produces the highest Sharpe ratio (1.04), while the Sandwich portfolio produces the lowest (0.33).
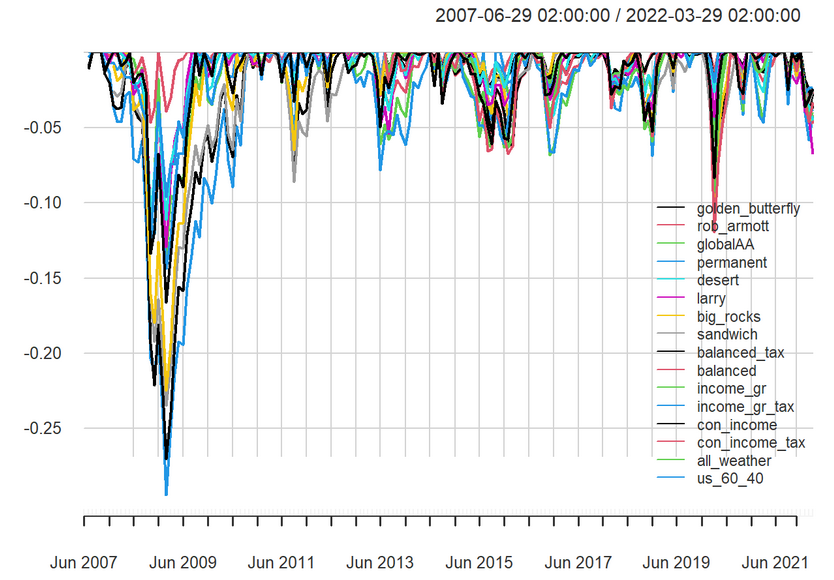
The drawdowns in 2007-2008 for most strategies are in the 10-20% range. The United Stated 60/40, which is (used to be?) considered by many as a good constant allocation benchmark, produces the highest drawdown at 29.5%. 

Cumulative returns since 2020 show that most strategies lose up to 10% during the first months of 2020 as the pandemic hits. Notice also the dip since end of 2021. 

DDs since 2020. Since most strategies have sizable allocations to bonds, it’s not surprising to see how they take a beating recently. 

Next step when I have time is to test tactical asset allocation schemes. I hope this will be helpful to someone.
• • •
Missing some Tweet in this thread? You can try to
force a refresh


