
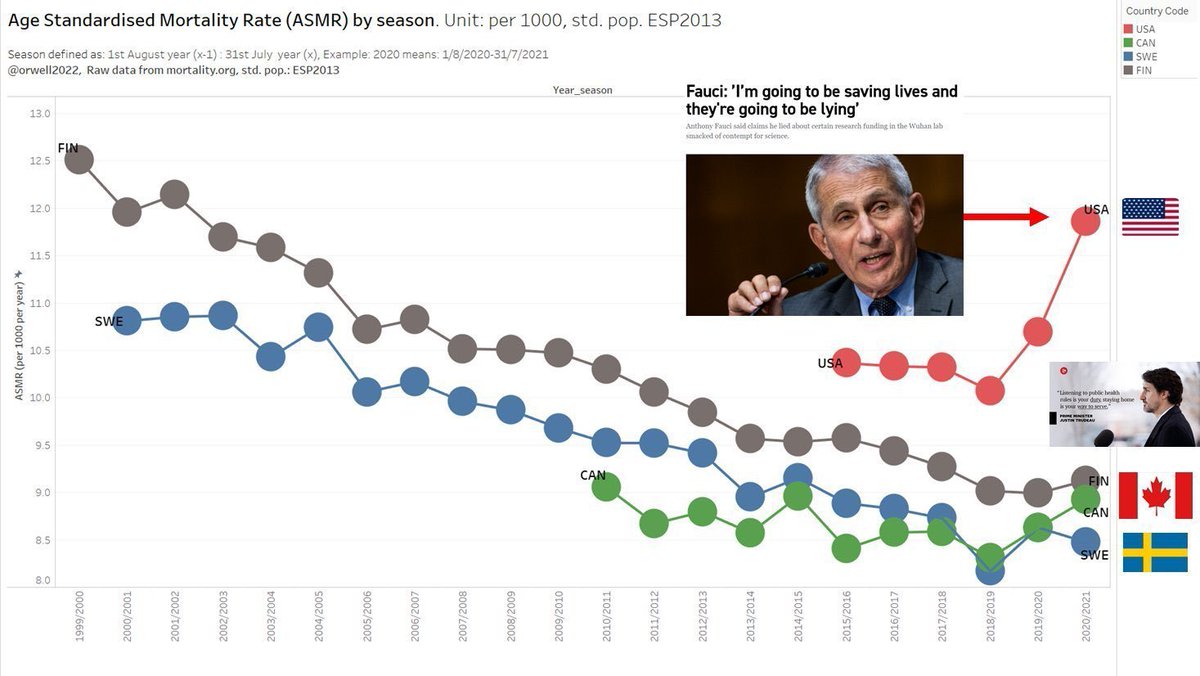
1/ What do you do, to distract from the "DEVASTATING" outcome in US?
Push #nocovid propaganda into “Humanities & Social Sciences Communications” and communicate:
"Sweden officials are a COVID deniers and failed."
Reality: SWE mortality looks like if Covid wasn't there.
Push #nocovid propaganda into “Humanities & Social Sciences Communications” and communicate:
"Sweden officials are a COVID deniers and failed."
Reality: SWE mortality looks like if Covid wasn't there.
https://twitter.com/DrEricDing/status/1509558565119352832

2/ In order to distract from US, they have to shame the very best with e.g. child hostile propaganda and lies.
The results speak for themselves. There is no better place for children than Sweden, Scandinavia, NL etc. in general.
The results speak for themselves. There is no better place for children than Sweden, Scandinavia, NL etc. in general.

3/ Here is some feedback to this #nocovid "communication" propaganda which is pushed by an Australian/Swedish "behavioural engineering" group.
https://twitter.com/ballouxfrancois/status/1506896628829016072?s=21
https://twitter.com/orwell2022/status/1508136233867923463?s=21
https://twitter.com/kasperkepp/status/1507327932771012608?s=21

4/ The #nocovid warriors must be panicking as the forecasted (by GBD) damage is becoming evident while Scandinavia is shining with dramatically lower mortality rates.
https://twitter.com/orwell2022/status/1508182931268947968?s=20&t=uXUJf5N36gUYZJA71VlbRw
https://twitter.com/orwell2022/status/1506273831543099404?s=20&t=uXUJf5N36gUYZJA71VlbRw

5/ Do not look at outcome but at the narrative: lockdown the healthy and children to saves lives.
They should try to explain this.
We do know that the mortality in <65 was highest where the shutdown was hardest. It also doesn't save the old.
They should try to explain this.
We do know that the mortality in <65 was highest where the shutdown was hardest. It also doesn't save the old.
https://twitter.com/digregjf/status/1500174552306905089?s=20&t=uXUJf5N36gUYZJA71VlbRw

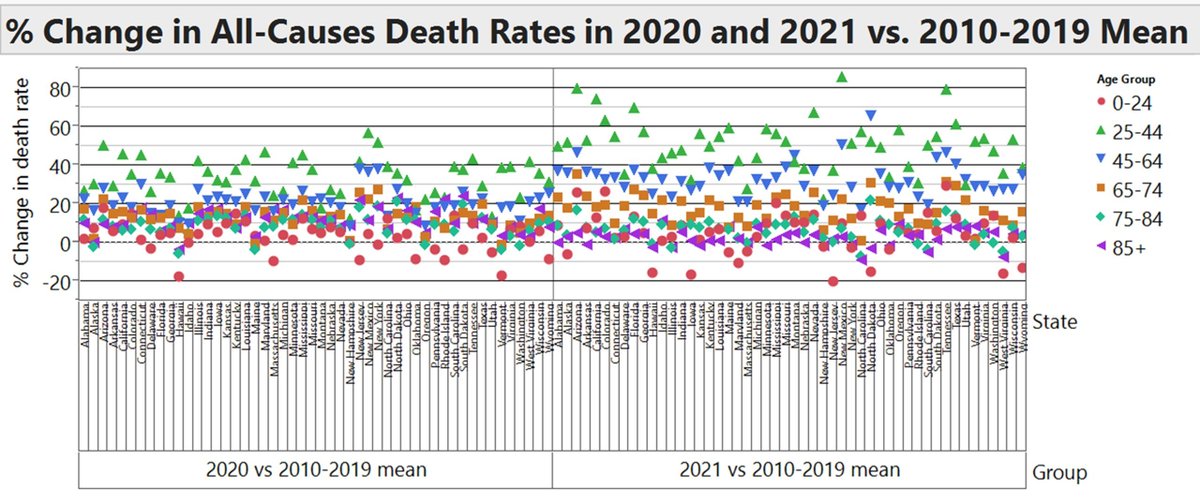
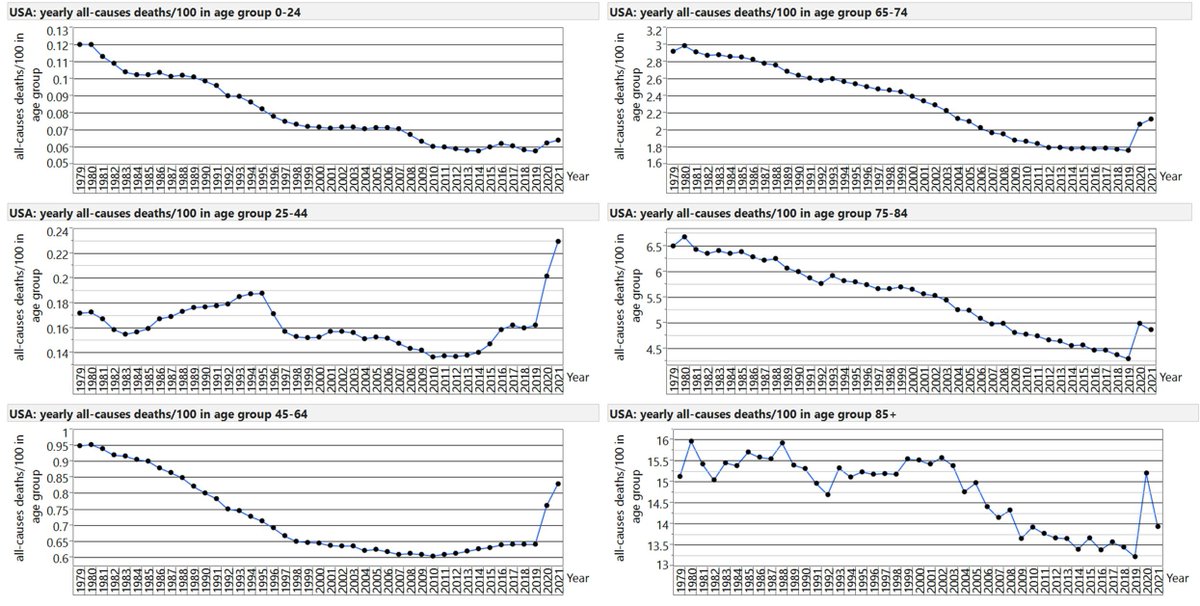
6/ The full picture of the damage in US can be seen below, while nothing happened in open unmasked Sweden.
The #nocovid cabal: The countries with the best outcomes failed because they did not obey "the science TM".
1+1=3.
The #nocovid cabal: The countries with the best outcomes failed because they did not obey "the science TM".
1+1=3.
https://twitter.com/digregjf/status/1489643821243592706?s=20&t=uXUJf5N36gUYZJA71VlbRw
https://twitter.com/digregjf/status/1490014518977523714?s=20&t=uXUJf5N36gUYZJA71VlbRw
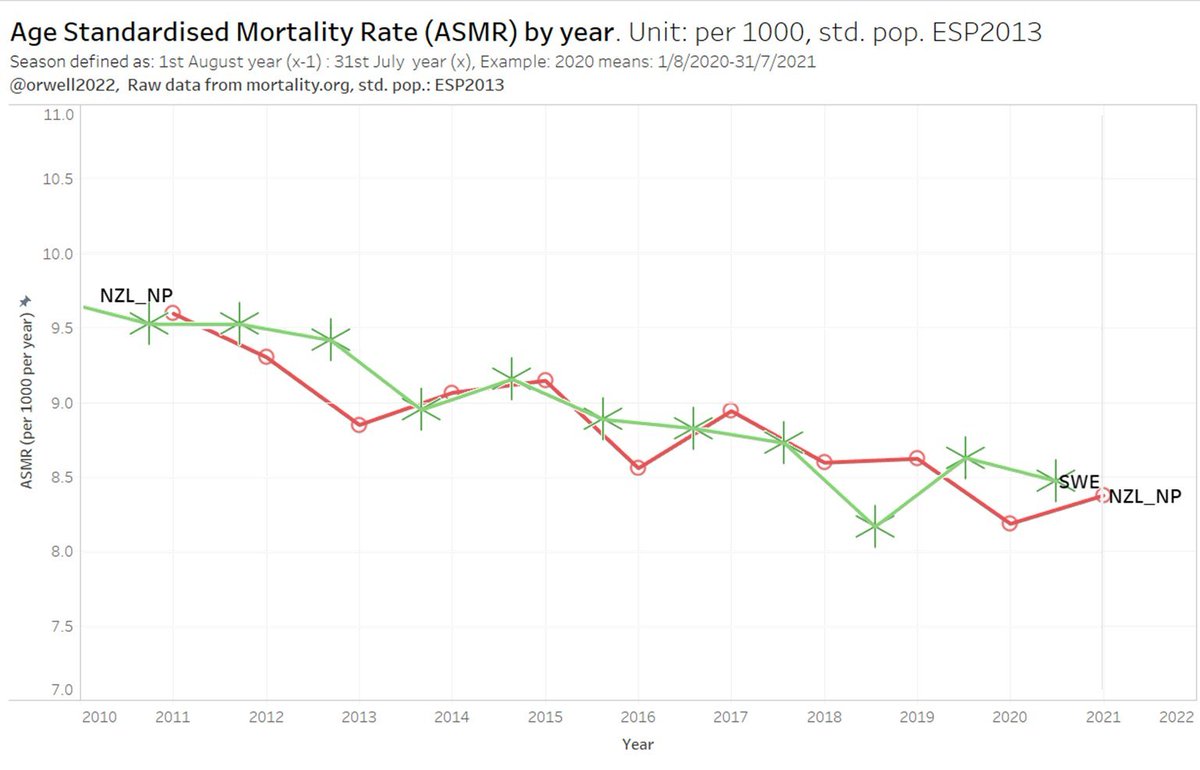
7/ Another absurd logic is the comparison with an isolated island with a favourable climate.
But also this comparison already turns in favour to Sweden, while New Zealand has it's first Covid winter ahead.
Sweden is through, NZ can only loose now.
orwell2024.substack.com/p/new-zealand-…
But also this comparison already turns in favour to Sweden, while New Zealand has it's first Covid winter ahead.
Sweden is through, NZ can only loose now.
orwell2024.substack.com/p/new-zealand-…
8/ One should also not forget what the doomsday cabal had forecasted for Sweden and the like:
-Total collapse
-The WORST results (ending up last) and not best.
That did not happen. Exceptions like NZ (full isolation) don't prove that US and most failed countries succeeded.
-Total collapse
-The WORST results (ending up last) and not best.
That did not happen. Exceptions like NZ (full isolation) don't prove that US and most failed countries succeeded.

9/ The religion goes like this:
If you locked down and had devastating outcomes (like US), your sins are forgiven.
If you did not lock down, but ended better or in the top 5% group, you still failed as you aren't first.
If you did lockdown and ended last, it's not a problem.
If you locked down and had devastating outcomes (like US), your sins are forgiven.
If you did not lock down, but ended better or in the top 5% group, you still failed as you aren't first.
If you did lockdown and ended last, it's not a problem.
10/ Applying this religion makes Florida a failure and CA/NY a role model.
Failure/success is independent of the outcome as only the narrative is counts.
It's woke DNC politics without logic.
Left is right, and right is left.
Failure/success is independent of the outcome as only the narrative is counts.
It's woke DNC politics without logic.
Left is right, and right is left.


11/ Let's add another view for @DrEricDing
US morality 15-64 has increased by 50% thanks to the #nocovid cabal.
That corresponds to ~200.000-300.000 extra deaths per year now in the 15-64 age group.
But Sweden "failed"?
US morality 15-64 has increased by 50% thanks to the #nocovid cabal.
That corresponds to ~200.000-300.000 extra deaths per year now in the 15-64 age group.
But Sweden "failed"?

12/ USA at least didn't blow up mortality in the 0-14 band. But we are talking about levels that are rather typical for emerging countries:
🇺🇸 250% higher 👎 than SWE 🇸🇪 💪
20.000 children 0-14 less would die in USA with the Swedish baseline. @EricPhDing doesn't want that.
🇺🇸 250% higher 👎 than SWE 🇸🇪 💪
20.000 children 0-14 less would die in USA with the Swedish baseline. @EricPhDing doesn't want that.

• • •
Missing some Tweet in this thread? You can try to
force a refresh


