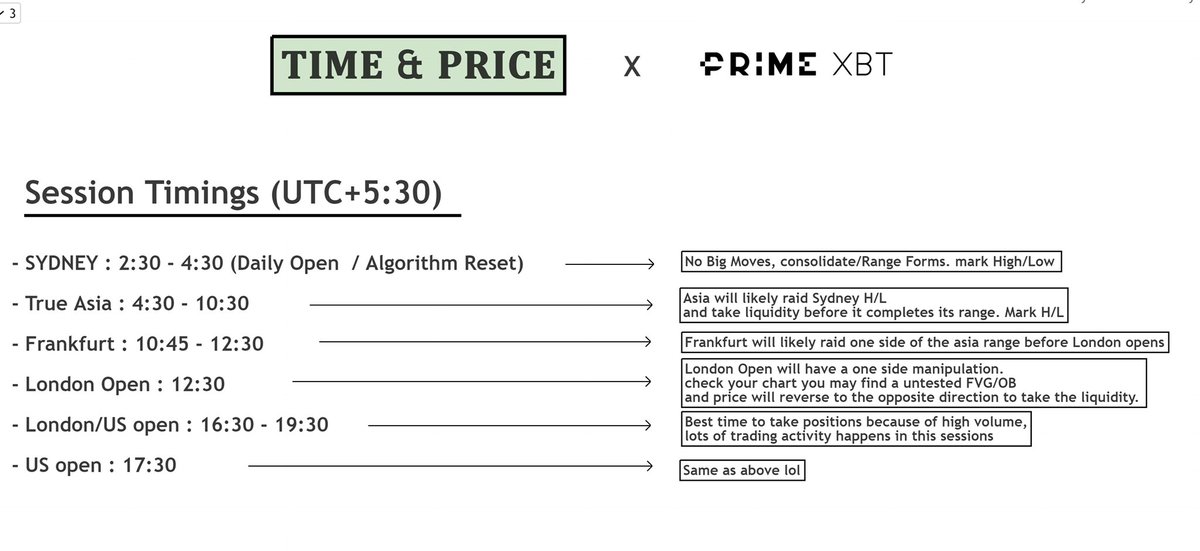
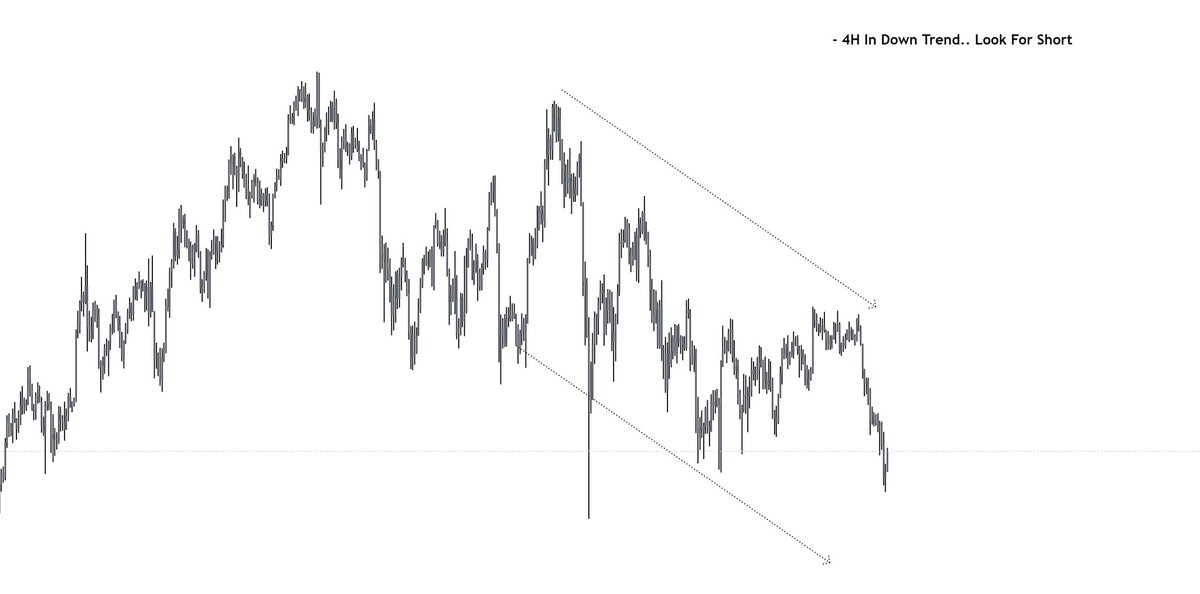
To all the people new to SMC struggling with setups,here's a simple yet profitable Trade plan im sharing with you all in a thread
Backtest and Master it if you really want to be in this game
Shared this in @duje_matic 's discord and much more to come insha'Allah
#BTC #SMC #ETH
Backtest and Master it if you really want to be in this game
Shared this in @duje_matic 's discord and much more to come insha'Allah
#BTC #SMC #ETH
1st thing to look when you open the chart is 'Market structure'
I have marked both HTF & LTF price movements
HTF will give u a better view of market direction,
LTF will be noisy & hard to find the direction for a newbie imo,multiple OBs,FVG/Imblance,will be hard to mark your POI
I have marked both HTF & LTF price movements
HTF will give u a better view of market direction,
LTF will be noisy & hard to find the direction for a newbie imo,multiple OBs,FVG/Imblance,will be hard to mark your POI

Once the BOS ( break of structure ) happens, wait for the retracement. Don't fomo, calm your tits and have patience.
As they say market will reward your patience
As they say market will reward your patience

2nd thing to Look into the chart is your POI (order block) ..
For me OTE (Optimal Trade Entry) method has worked the best.
And personally i look for OBs at/below 0.79% i call it 'The G-spot' entry
For me OTE (Optimal Trade Entry) method has worked the best.
And personally i look for OBs at/below 0.79% i call it 'The G-spot' entry

2nd thing to Look into the chart is your POI (order block) ..
For me OTE (Optimal Trade Entry) method has worked the best.
And personally i look for OBs at/below 0.79% i call it 'The G-spot' entry
For me OTE (Optimal Trade Entry) method has worked the best.
And personally i look for OBs at/below 0.79% i call it 'The G-spot' entry

• • •
Missing some Tweet in this thread? You can try to
force a refresh


