🧵on U.S. distillate (diesel) markets #OOTT

Long story short - the U.S. East Coast had a large part of it's import blanket pulled out from under it.
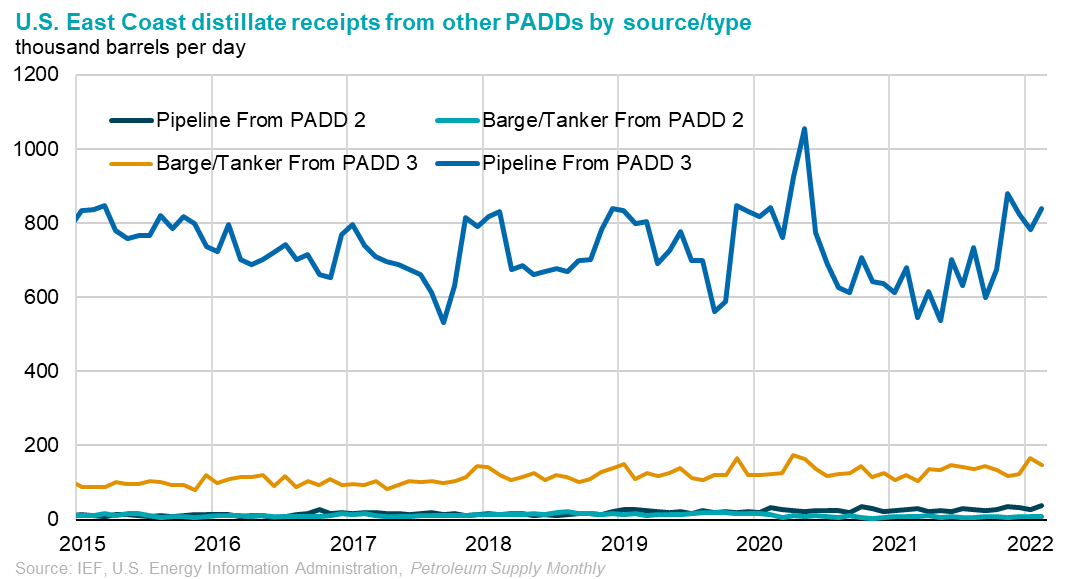
Looking at the PADD1 distillate supply/demand balance we can see that as in-region refinery production decreased due to refinery closures, PADD1 first relied on receipts (pipeline/tanker/barge) from other PADDs.
As the pandemic hit, (early 2020) the East Coast was inundated with supply up Colonial and Plantation Pipelines but then those receipts fell to around 600kb/d, until about Q3/4 of 2021.
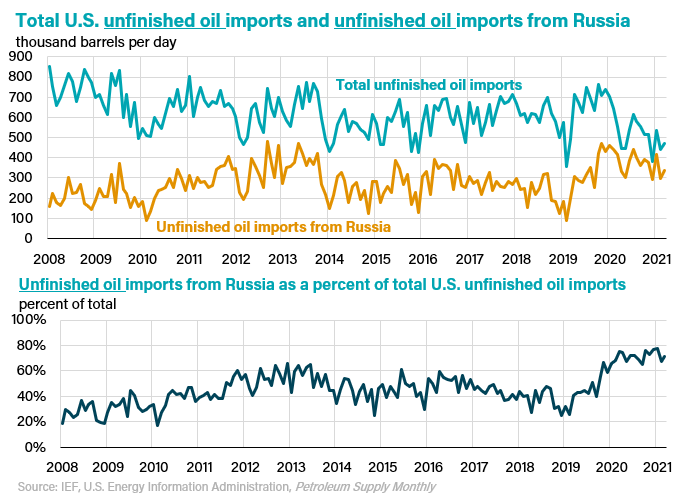
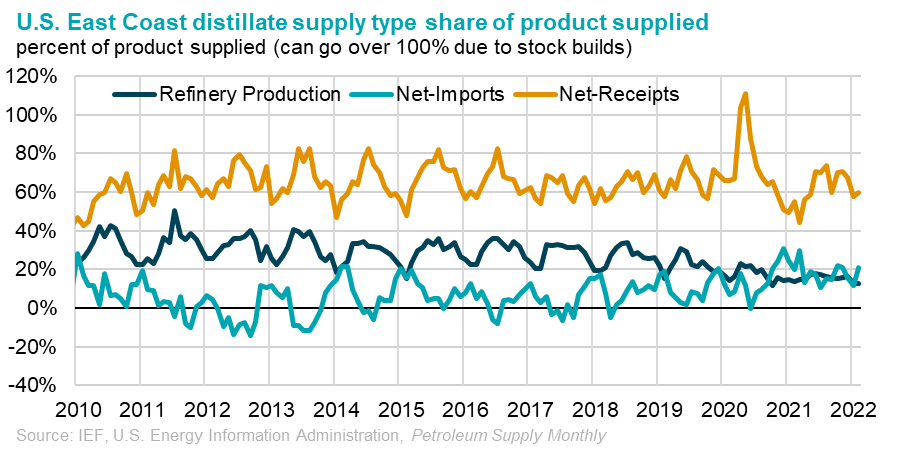
This reshuffling (refinery closures, pandemic, etc.) resulted in imports of distillate becoming a larger part of the East Coast's distillate supply. Which, when times are normal is ok, many countries/regions do it. However, things aren't "normal" nowadays are they?
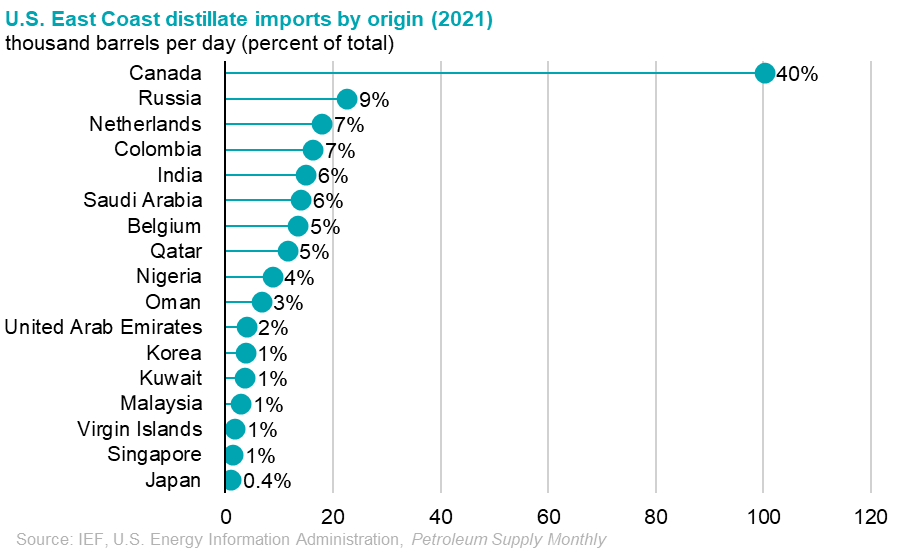
In 2021, imports from Canada represented 40% of total PADD1 distillate imports. But, look at #2: Russia with 9%, then Netherlands 7%, and a bit farther down Belgium 5%.
Even in the latest data (February 2022) Russia was 20% of distillate imports, with Netherlands and Belgium 12% and 8%, respectively.

See where things are headed?
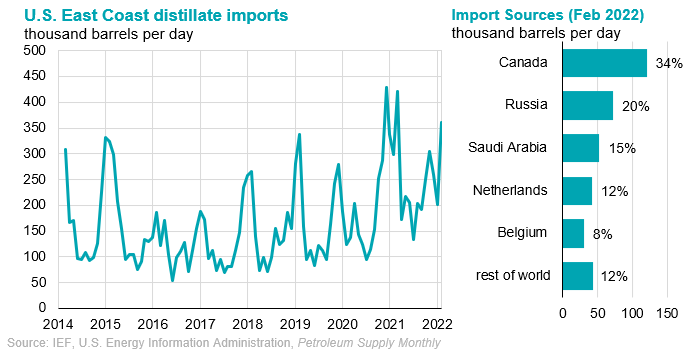
As you know, things with Russian distillate imports got....complicated in late Feb/March, and thus complicated for refineries and distillate supplies in Belgium and the Netherlands - and by extension the U.S. East Coast.
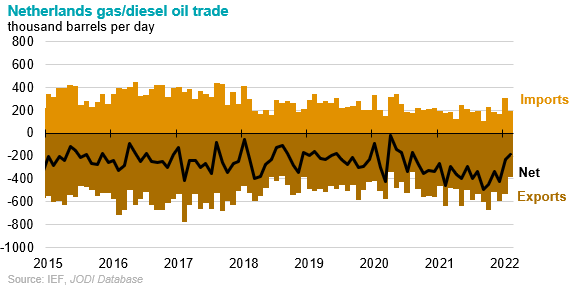
In the most recent @JODI_Data exports of gasoil/diesel from the Netherlands fell to 382kb/d in February, compared to 632kb/d in Feb of 2021.
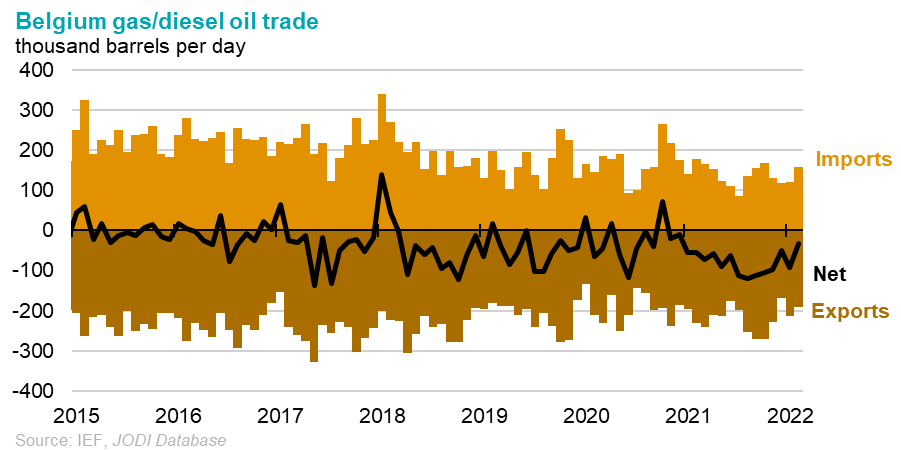
In Belgium, @JODI_Data shows gasoil/diesel exports were down slightly, to 189kb/d in Feb 2022, compared with 230kb/d at the same time last year.
An additional complication: Refineries in Netherlands and Belgium historically imported intermediate feedstocks from Russian refineries, processing it to make gasoil/diesel.
This data is all through February, but March data is likely to show similar and stronger signs of the trends highlighted in this thread.
So to recap, East Coast refineries close, pandemic hits, pipeline shipments surge, demand recovers, inventories drawn down while reliance on imports increases.
Then in March 22, the U.S. East Coast is forced to replace lost Russian distillate imports, as well as lost imports from E.U. in a market where everyone is trying to buy available distillate barrels. Hence, inventories down & prices up. I hope this helps.
Another note: One of my favorite reports from @EIAgov is due out next month - the Annual Refinery Capacity Report. This report will provide LOTS of details about refinery downstream unit capacities and will help with analysis considering all that's changed recently.

• • •

Missing some Tweet in this thread? You can try to force a refresh
 

Keep Current with Mason Hamilton🛢📊⛽️

Mason Hamilton🛢📊⛽️ Profile picture

Stay in touch and get notified when new unrolls are available from this author!

Read all threads

This Thread may be Removed Anytime!

PDF

Twitter may remove this content at anytime! Save it as PDF for later use!

Try unrolling a thread yourself!

how to unroll video
  1. Follow @ThreadReaderApp to mention us!

  2. From a Twitter thread mention us with a keyword "unroll"
@threadreaderapp unroll

Practice here first or read more on our help page!

More from @T_Mason_H

May 12
Those of you who've followed me for a long time know, I have been a fan and defender of EIA my entire career. Sadly, that comes to an end today. This new API data browser is a massive step backwards in terms of usability and accessibility for EIA's data.
The old system was massively easier to use and understandable than this V2. I could navigate to what I wanted, click the key, get the code, copy/paste into excel, then run the EIA excel plug-in and boom my data appears. But now...
Now, I can navigate to the data series I want on the website, but as soon as I click the blue arrow I have to start from a generic menu of data items. Now I'm forced to go from PADD1 imports of Distillate fuel oil - all the way back to energy source!?!?! Image
Read 8 tweets
May 28, 2021
Allow me to head off any confusion about recent U.S. - Russia import numbers. (thread) #OOTT Image
Russia is not a significant source of crude oil for U.S. refineries. But because total U.S. crude oil imports have fallen, Russia's share has gone up - that's basic math. Image
However, Russia is a significant supplier of "Unfinished oil" imports. Image
Read 8 tweets
Jan 22, 2021
Interesting: Many vehicle manufactures have turned to Turbochargers - squeezing more power out of smaller engines but needing higher octane gasoline (premium) for optimal performance (i.e. what the EPA sticker says). #OOTT
This means more cars likely say "Premium recommended" (i.e. to get EPA sticker numbers), and not "Premium Required". At the same time, the share of premium gasoline sales is rising - up to 13%, the highest it's been since ~2003, and have recovered faster than other grades.
The share is even higher if only considering Reformulated gasoline - 18%, the highest share since ~2001
Read 4 tweets
Dec 16, 2019
Despite the many events and developments in the oil world in 2019, the thing I think was the most influential = Satellites.
(Thread) #OOTT
There are now numerous satellite data service providers and entirely new analytical insights built from them. From the tracking of ships, reading of inventories from space, to tracking oil rig deployments, and even pipeline construction.
While these services are not new per se in 2019 - I think they certainly came to the forefront this year. For example: the analytical community was able to see and examine the aftermath of the attacks in Saudi Arabia almost the next day from satellite imagery.
Read 7 tweets
Dec 4, 2019
In September 2019, the United States exported 89,000 barrels per day (b/d) more petroleum (crude oil and petroleum products) than it imported, the first month this happened since monthly records began in 1973. #OOTT #TWIP
bit.ly/38b67Kn
The United States is a net exporter of petroleum!
*me in my office when data was released...
Now - before everyone gets giddy let's put things into the proper context.
Read 10 tweets
Jul 17, 2019
The EIA'S Weekly Petroleum Status Report provides weekly estimates of U.S. crude oil supply, including a measure of how well the supply of crude oil and the disposition of crude oil balance with each other. This measure is called the "adjustment". #OOTT bit.ly/32tS2od
If the reported supply and disposition of crude oil balanced perfectly each week, the adjustment would equal zero. For several reasons, however, this is rarely the case. Hence the need for the adjustment.
Weekly U.S. crude oil supply and disposition data are based on a combination of EIA survey data, U.S. CBP data, and modeled estimates. All statistical samples using survey data have small but unavoidable imprecisions, and model estimated data’s precision can vary.
Read 19 tweets

Did Thread Reader help you today?

Support us! We are indie developers!


This site is made by just two indie developers on a laptop doing marketing, support and development! Read more about the story.

Become a Premium Member ($3/month or $30/year) and get exclusive features!

Become Premium

Don't want to be a Premium member but still want to support us?

Make a small donation by buying us coffee ($5) or help with server cost ($10)

Donate via Paypal

Or Donate anonymously using crypto!

Ethereum

0xfe58350B80634f60Fa6Dc149a72b4DFbc17D341E copy

Bitcoin

3ATGMxNzCUFzxpMCHL5sWSt4DVtS8UqXpi copy

Thank you for your support!

Follow Us on Twitter!

:(