🧵Biden's economic records indicating a massive boom underway, from those working full-time to corporate profits, with graphs and links to definitive sources. #BidenBoom
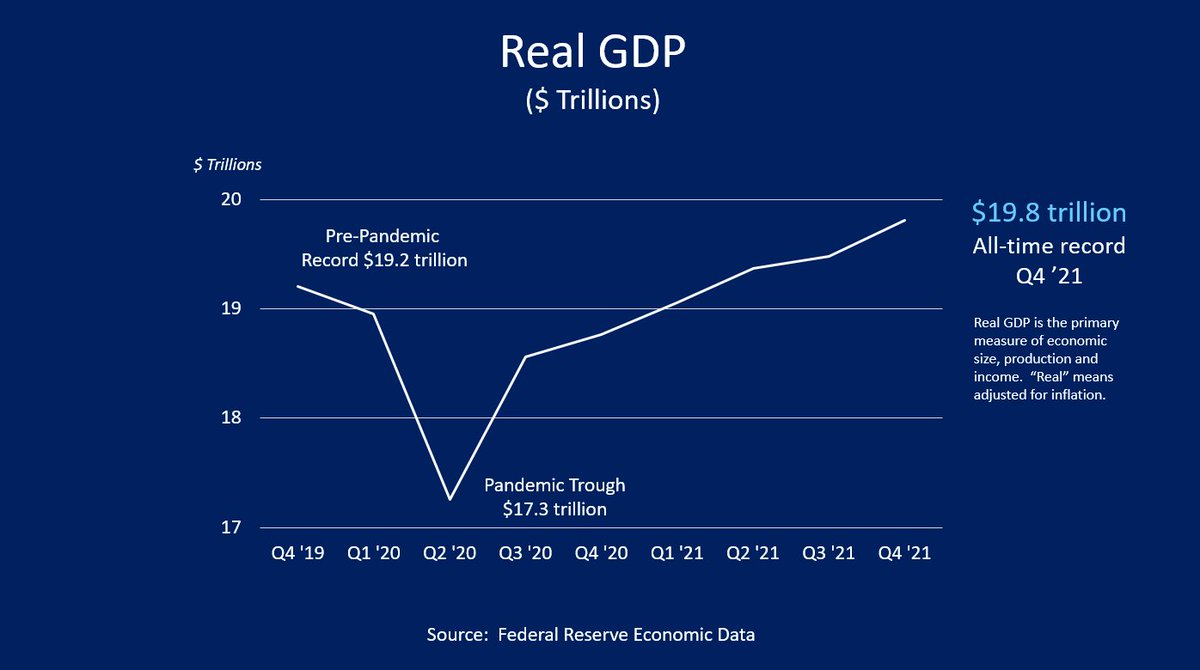
Real (inflation-adjusted) GDP hit record level in Q4 '21, after regaining the pre-pandemic peak in Q2 '21. This measures the size of the economy for both production and income. 2/ fred.stlouisfed.org/series/GDPC1
Americans are the richest ever measured by net worth, which reached $150 trillion for the first time in Q4 '21. This was due to stock and housing booms. 3/ fred.stlouisfed.org/series/TNWBSHNO
The number of job openings hit a record 11.5 million in March 2022, another sign of the booming labor market and immigration restriction. There are about 2 open jobs per unemployed person, also a record. 4/ fred.stlouisfed.org/series/JTSJOL
The stock market (S&P 500) reached an all-time record 4,797 on January 3, 2022. Inheriting a near-record stock market level, Biden still set the presidential record of a 37% return measured for his first year from election, with a peak of +42%. 5/ fred.stlouisfed.org/series/SP500
Housing prices, as measured by the median sales price of houses sold, reached an all-time record of $428,700 in Q1 '22, a nearly $70,000 or 20% gain from Q4' 20. About 65% of American households own the home they live in. 6/ fred.stlouisfed.org/series/MSPUS
A record few persons are receiving unemployment compensation, with the share of the labor force at an all-time low of 0.86% in April 2022. This is yet another sign of a very hot labor market. 7/ fred.stlouisfed.org/graph/?graph_i…
The federal budget deficit is falling at a record pace, and not just because pandemic spending programs are ending. Revenues are up enormously, nearly $1 trillion versus fiscal year 2019 pre-pandemic, due to high incomes and economic activity. 8/ cbo.gov/publication/57…
Corporate profits are about 40% above pre-pandemic levels, reaching an all-time record of $2.7 trillion in Q4 '21. Democrats appear to be good for business! 9/END fred.stlouisfed.org/series/CP
• • •
Missing some Tweet in this thread? You can try to
force a refresh
🧵Monthly economic update, through the February 2025 results, Trump's first month. First, we added 151,000 jobs in Feb and are now nearly 7 million jobs above the pre-pandemic peak, which was regained in June 2022. We've set records for number with jobs monthly thereafter. 1/
Job creation (Establishment Survey) has averaged about 200,000 over the past 3 months, very solid historically. 2/
The more volatile Household Survey was mostly negative, with a 588,000 decline in the number employed and 203,000 more unemployed. The unemployment rate increased from 4.0% to 4.1%, still very low by historical standards. 3/
🧵Where does the national debt come from? 1. Recessions, which cause revenue to fall and automatic stabilizer spending (like unemployment insurance) to rise w/o legislation. 2. Tax cuts 3. Wars 4. Recessions, via stimulus legislation 5. Interest 1/ cbo.gov/sites/default/…
Recessions and the responses (automatic and legislative) are the primary driver. 10 of the last 11 started under Republicans. Every Republican president since Benjamin Harrison, who served from 1889 to 1893, had a recession start on their watch. 2/
Budget deficits have increased under every Republican but Eisenhower, and fallen under every Democrat but Kennedy. Deficits increase/worsen 3.25% GDP on average under Republicans, and fall/improve by 3.0% GDP under Democrats. So who's the party of fiscal responsibility? 3/
🧵Monthly economic review, through the Jan '25 data, Biden's last month. First, we added a decent 143,000 jobs in January. We're up about 6.7 million jobs from the pre-pandemic peak, which was regained in June 2022, and 16.1 million vs. Biden start. 1/ fred.stlouisfed.org/series/PAYEMS
The monthly job creation rate had been fading, but surged in the past 3 months to a robust 237,000 average. This was after benchmark revisions, done routinely each year. 2/
No matter how you slice it, job creation under Biden was faster than Trump, even comparing Trump pre-pandemic (180k/mo) to Biden post-recovery (217k/mo). 3/
🧵The MSM created 4 fake crises (Inflation, Immigration, Housing, and Crime), which helped Trump get elected while hiding record prosperity. Here are slides explaining the counter-arguments to such misinformation, plus a few charts and links included for more details. 1/
Facts regarding the false narratives on housing and crime. 2/
Wages & Inflation should be reported in context. Purchasing power is what matters.
☑️Wages have outgrown inflation.
☑️Real (inflation-adjusted) wages have always been higher than 2019 during 2021-2024.
☑️Biden has the highest avg. real wages among the last 11 presidents. 3/
🧵President Biden's economic legacy, in charts. First, the unemployment rate at 4.1% on average is the lowest (best) among the last 14 presidents, for FRED data back to 1948. 1/
The real (infl-adj) hourly wages for production & non-supervisory workers (the bottom 80% of the private sector) averaged higher under Biden than the last 11 presidents. In other words, workers had more purchasing power under Biden than other presidents, despite inflation. 2/
Taking the first two charts together, Biden has the best combination of unemployment and real wages among the last 11 presidents. This is the best reading on the "Prosperity Matrix" of any modern president. 3/
🧵Monthly economic update, through November:
First, job creation was +227,000 jobs, or +283,000 after upward adjustments to Sept & Oct. We're now +16.4 million jobs from when Biden started and +7.0 million vs. pre-pandemic peak regained in June 2022. 1/
🏆Biden is the only president with positive job creation every month in office.
No matter how you slice and adjust it, job creation is much faster under Biden than Trump:
The unemployment rate increased by 0.1% in November, to 4.2%. The historical average back to 1948 is 5.7%. The 2022 & 2023 annual average of 3.6% was lower than Trump's best of 3.7% in 2019. The last 3.5% year was 1969. 3/