Time for the 2022 Q1 update on the Global monetary base. This is the only money supply that economically compares with bitcoins. Current price weakness drops #Bitcoin under the Swiss franc and silver vs. last quarter. This is quarterly update #16. 🧵 
2/ This research covers the globe's top 50 fiat currencies, sourced directly from their central banks. You won't find this info anywhere else. Also we look at historical basic money stocks (i.e. gold & silver). Layer in #Bitcoin and we cover it all.
3/ It's important to keep tracking corporeal data like this, because it follows the money to the core of the system. Many like to say central banks run the printing presses into the ground. But how much do they… really? What does it all mean?
4/ The effort here is to paint a true monetary landscape across the globe. Also we seek to understand 'unit-upon-unit' growth of each currency, and compare them. We're looking at the dollars, euros, and yen we're all familiar with, but also 47 more currencies.
5/ Gold & silver is basic money of the past. Government fiat cash is basic money today. It comprises both physical cash *and* a digital cash component. Bitcoin may be base money of the future. Before we show the charts, it's important to clarify exactly what basic money is.
6/ Everyone looking to value Bitcoin always jumps to the 'narrow' or 'broad' money supplies (M1/M2/M3). This is incorrect. The reason is those money supplies represent 'claims' on something else. What is that something else? The answer... is the basic money supply.
7/ Fiat basic cash today includes both physical (notes & coins) and digital (bank reserves at the central bank) components. Think of the digital part as the 'account' each bank holds with its central bank. This & only this money supply compares economically with 21 million BTC.
8/ Why? Because that's the end of the line. It's *final*…settlement, in either system. There's no deeper level you can go to in the current financial system than the monetary base, and there's no deeper level you can go to in the Bitcoin system than on-chain bitcoins.
9/ This is why all the Visa/Mastercard comparisons, TPS, etc. lose the plot. #Bitcoin is basic money that settles globally, in 10 minutes. In the fiat system, credit/debit cards, etc. are all higher-level monetary 🤜claims🤛 issued by banks. It's different stuff, not basic money.

10/ Another mistake often made when comparing bitcoins to the analog monetary world is looking at a simple chart like US M1, or Eurozone M2. Besides again being incorrect on the M1/M2/M3 comparison, this method is inadequate because Bitcoin is global, and those... are not.
11/ We can't simply look at one or two nation states' base money supplies to gauge any kind of market depth. The sample must be global. We've done that here: the top 50 currencies in the world. This is how basic monetary media issued by governments looks since 1970.

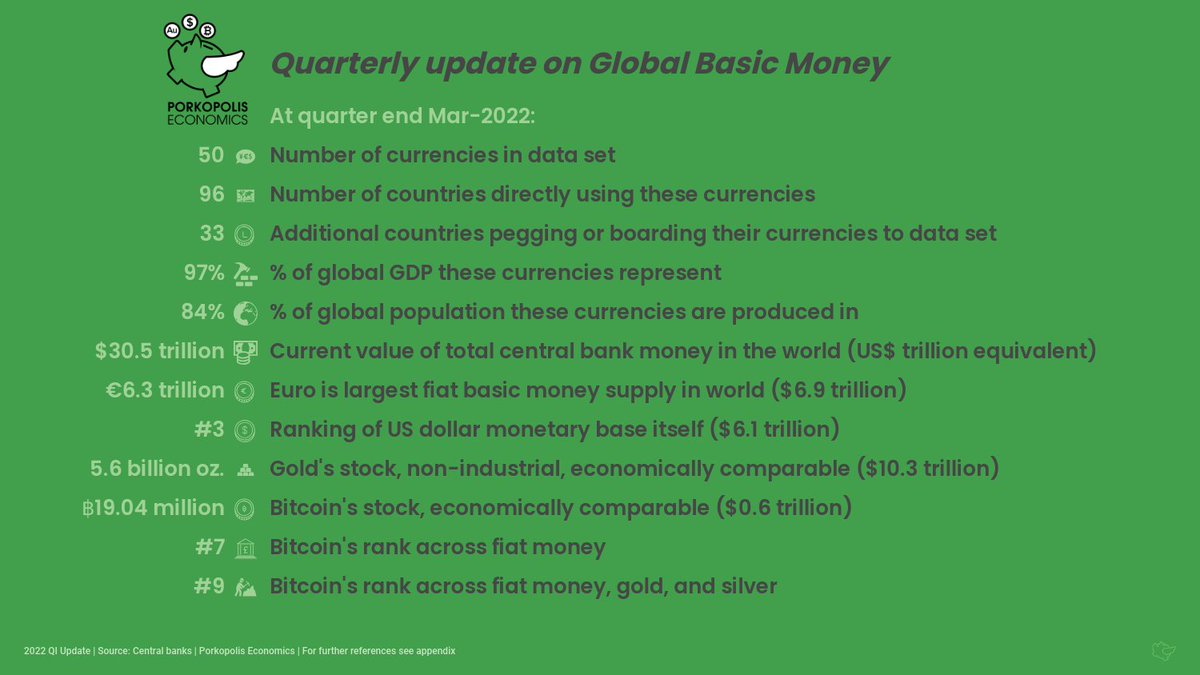
12/ These top 50 currencies in fact cover 97% of global GDP across 96 countries. As well, an additional 33 countries are legally pegged to one or fixed via currency board.
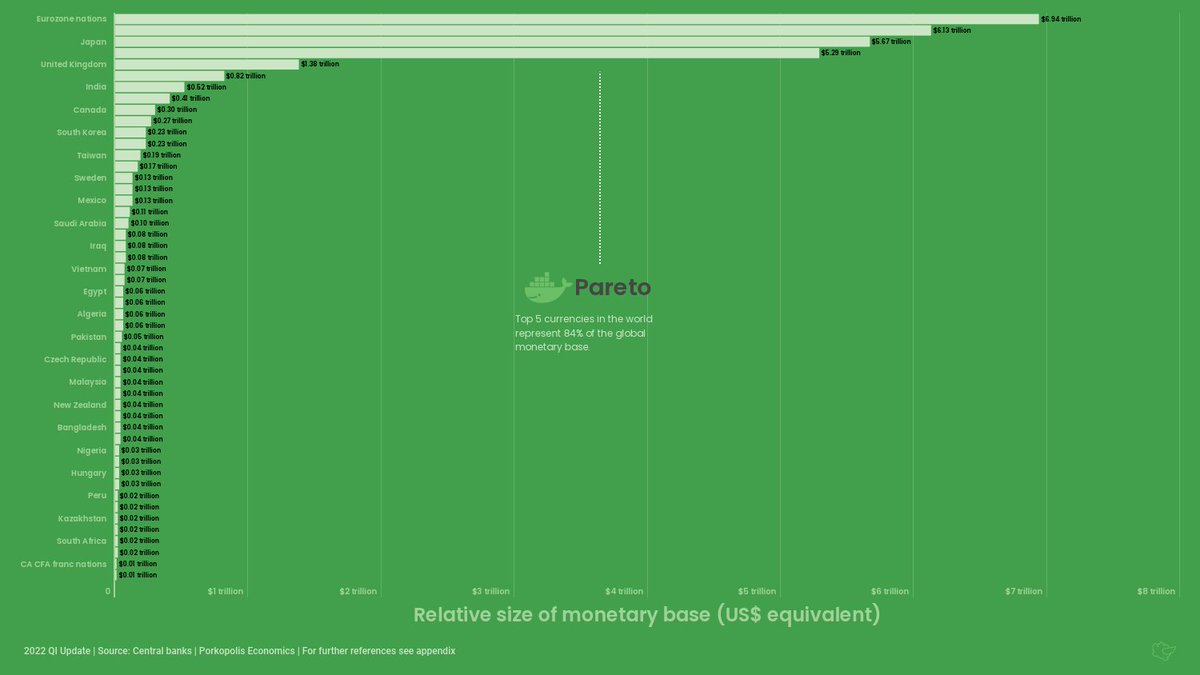
13/ The prior chart was ordered by GDP per currency bloc (US largest). Now check out the current money supply ranking of all currencies. Pareto. The top 5 currencies in the world comprise 83% of the value here. The balance is taken up by the next 45 currencies.
14/ Now check out the weightings on a map. The 4 dominant currencies are the euro, the dollar, the yen, and the yuan. Darkest shades.

15/ Let's look again at the global money supply curve since 1970, but this time see how the split shakes out between physical (retail) cash, versus digital bank (wholesale) cash. Today central banks push more money out with keystrokes rather than paper printing presses.

16/ To be clear: The monetary base is a graph of the money monopoly today; meaning, it is the 'source' of the printing press, and only central banks control this. Curious where to find it? Just look at the balance sheet of each central bank.

17/ And here's what the money supply looks like on a per capita basis, globally. Note that all the chatter about CBDCs will filter into the 'retail' category; namely, how physical cash trades today.

18/ Now let's look at each country/currency on a per capita basis, but sorted by GDP. Notice how base money per capita varies widely down the list. Check out the Norwegian krone, the dollar, yen, and the Swiss franc.

19/ Here are some more ways to look at global money. The top 5 economic blocs in the world (65% of GDP) produce 83% of the world's money, yet comprise 29% of the globe's population.

20/ And another way, let's only look at the top 5 'liberal democratic blocs' in the globe. To do this, swap out China for Switzerland. Now you're looking at 69% of the world's money produced in countries that represent 47% of the economy and only 11% of the globe's population.

21/ One more on fiat cash. We've been looking at the money supply in US$ equivalent, as we need a unit of comparison. This one is for fun (kinda). Here are the *native* currency units printed and outstanding for each central bank. Can you locate yours?

22/ Now let's look at gold. Central banks still hold gold, but it no longer acts as basic money. This chart is delineated between all-time gold mined, gold that's readily available (jewelry + bullion but ex-industrial), and estimated gold in bullion form (coin & bars).

23/ Still on gold, here's a chart you don't see everyday. It's central bank gold holdings vs. their base money. For those that still view gold as a market money, then any fiat money central banks can print above their gold holdings is - by definition - seigniorage.

24/ True, many emerging market central banks are net buyers of gold these days; but actually, central banks hold less gold collectively than in 1965. Notice how high the proportion of gold reserves-to-issued base money was in 1980 (both valued in US$). Today, it's less than 7%.
25/ In other words, central banks collectively have issued ~$28 trillion in base money *above* the value of their gold holdings (again, both marked to market in USD). This is an important fact that has implications for central bank money printing, for gold, and for bitcoin.
26/ What is that implication? So far, the money monopoly 'works' for central banks, and for their governments. It's virtually costless: fiat has proven to be nearly 'unconstrained' by the market value of gold. Some claim CBs manipulate the gold price; we won't address that here.
27/ As for #Bitcoin, if and when it becomes large enough to be on that chart, and held by central banks, only then will we know what bitcoin 'costs' central banks. For now, bitcoin costs central banks nothing in seigniorage; it's a rounding error. But it's growing. Quickly.
28/ Now silver. 55 billion ounces of the stuff has been mined throughout humanity. Same as gold, we include 3 categories: 'all-time' mine production, 'available' estimates (i.e. not lost to industry), and bullion estimates (coins & bars). Since 1970, this is silver.

29/ And finally Bitcoin. Bitcoins are limited by the protocol to an eventual 21 million in supply by ~2141, and with each day it seems that bitcoins could circulate as basic money of the future: a deep & balanced final settlement money supply. Here's its global supply curve.

30/ And now we'll put them altogether.
Global fiat cash...
'Available' gold...
'Available' silver...
and #Bitcoin.
Chart begins at the start of the Bitcoin era.
Global fiat cash...
'Available' gold...
'Available' silver...
and #Bitcoin.
Chart begins at the start of the Bitcoin era.

31/ And for a broad, historical ranking in table format, a progression of all major money for the entirety of #Bitcoin's history since 2009, that information is here. Quite remarkable to see its progress, even during the dips…

32/ And for those that wish to see the same progression but for all 50 currencies, and how quickly (if) #Bitcoin passed each one, that table is here.

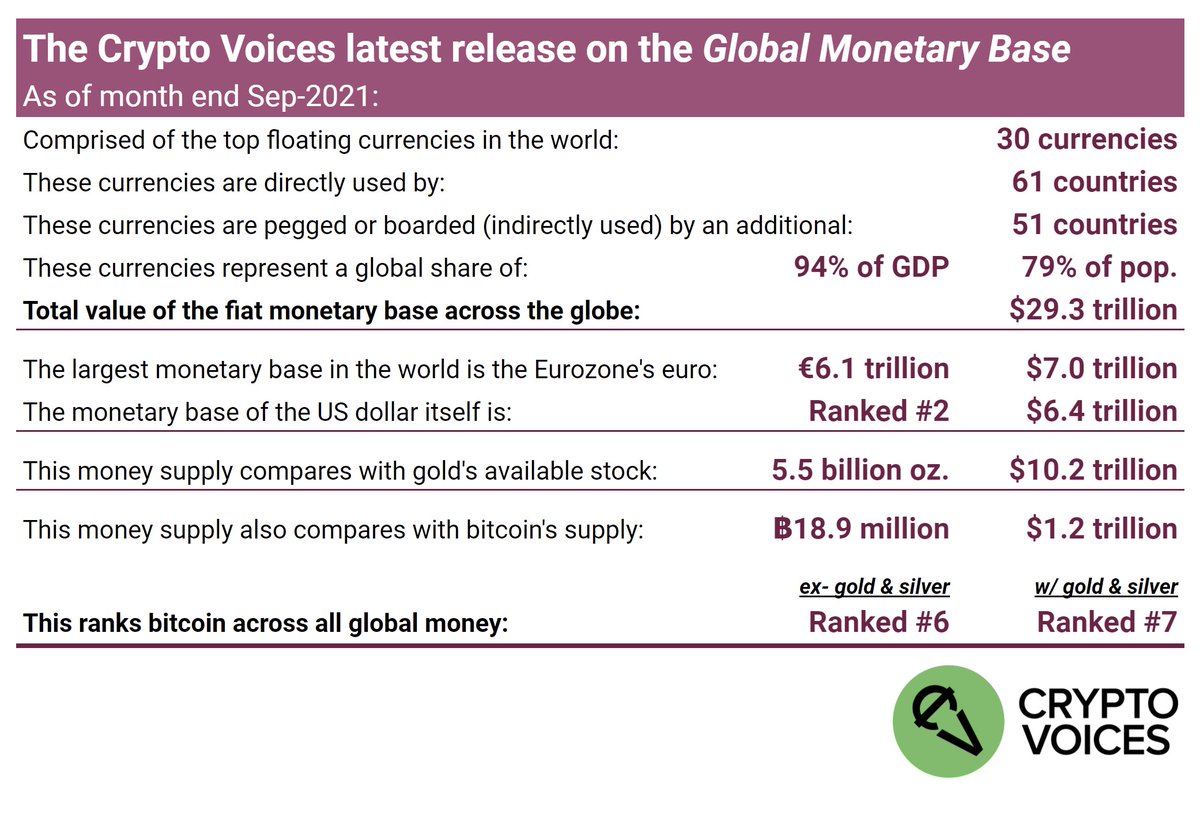
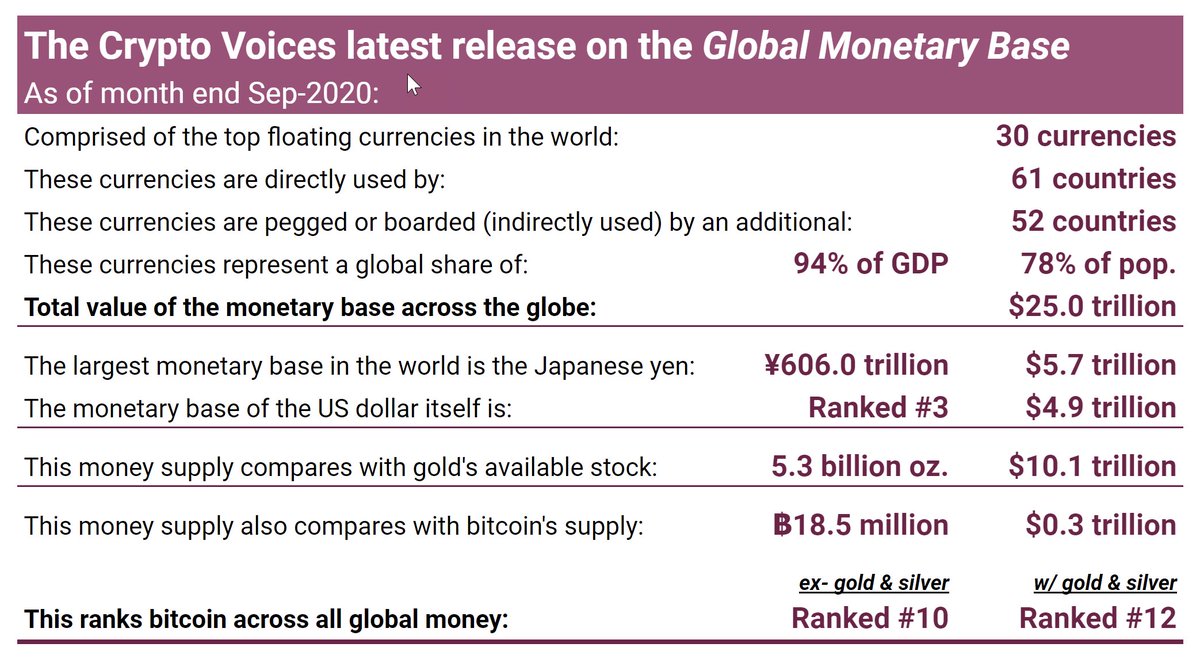
33/ Here's the last slide on value comparisons. The first block breaks down the fiat money supply only. The second block adds in gold, silver, and bitcoins into the mix.

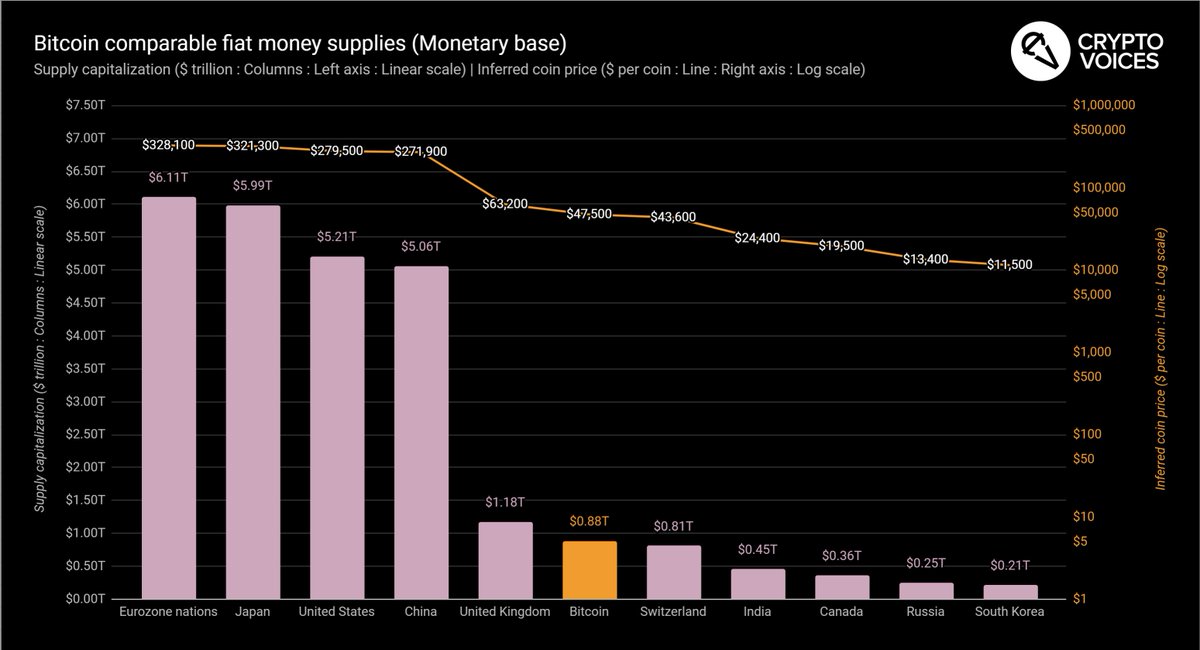
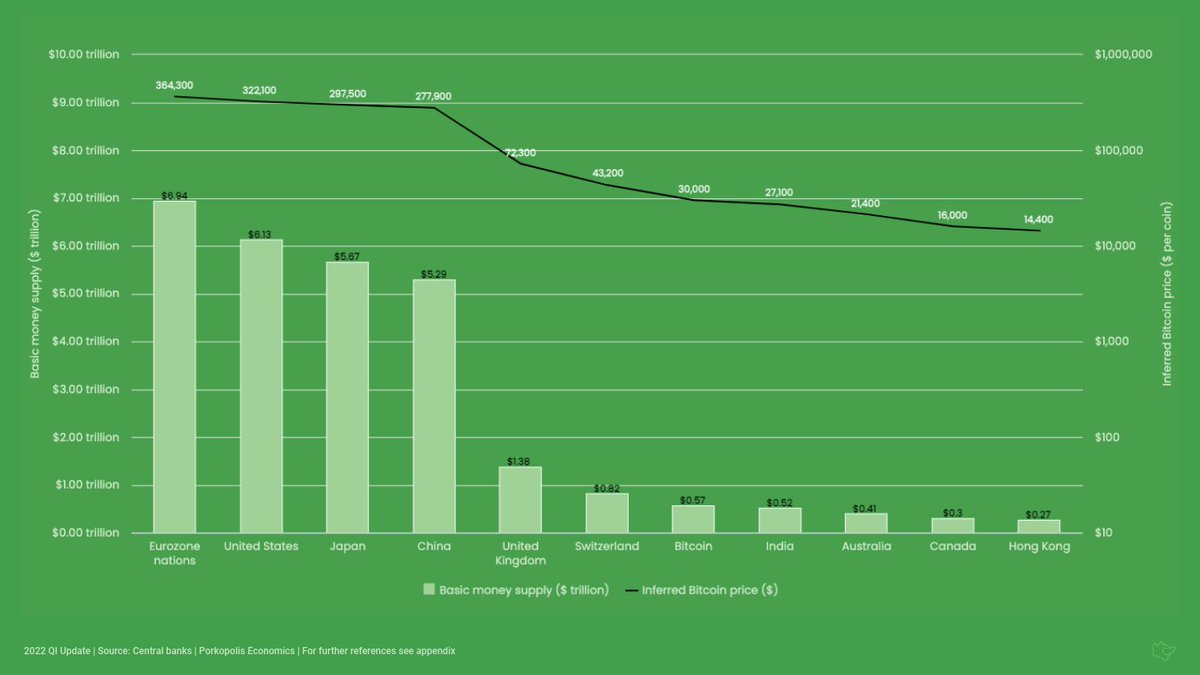
34/ Now let's look at Bitcoin specifically against fiat cash. Even though bitcoins are showing weakness right now in the market, the price it will take to match all major currencies in the world may surprise you.
35/ And compared against gold and silver. Bird's eye. Not that of all the 'transparent,' reported repositories of bullion (sourced from Nick Laird)… including all ETFs, even @PeterSchiff's GoldMoney... #Bitcoin has passed gold & silver in all of these vaults *combined.*

36/ Now for the main event: Inflation. Inflation today means 'price increases.' It's usually measured by the government and usually wrong. There is no way all prices can ever be blended and captured in a simple index. The input variables are changed all the time to boot.
37/ When we analyze inflation, we are using the classical definition, which is 'monetary inflation.' In other words, 'money growth,' or 'money production.' Understanding this rate of increase can be very helpful when trying to understand money.
38/ Inflation is one of the most important things to understand about money, in fact. Money growth inflation reflects scarcity, and dilution, relative to other goods. But to be clear, 🤜the charts that follow have nothing to do with price growth, or prices, at all.🤛
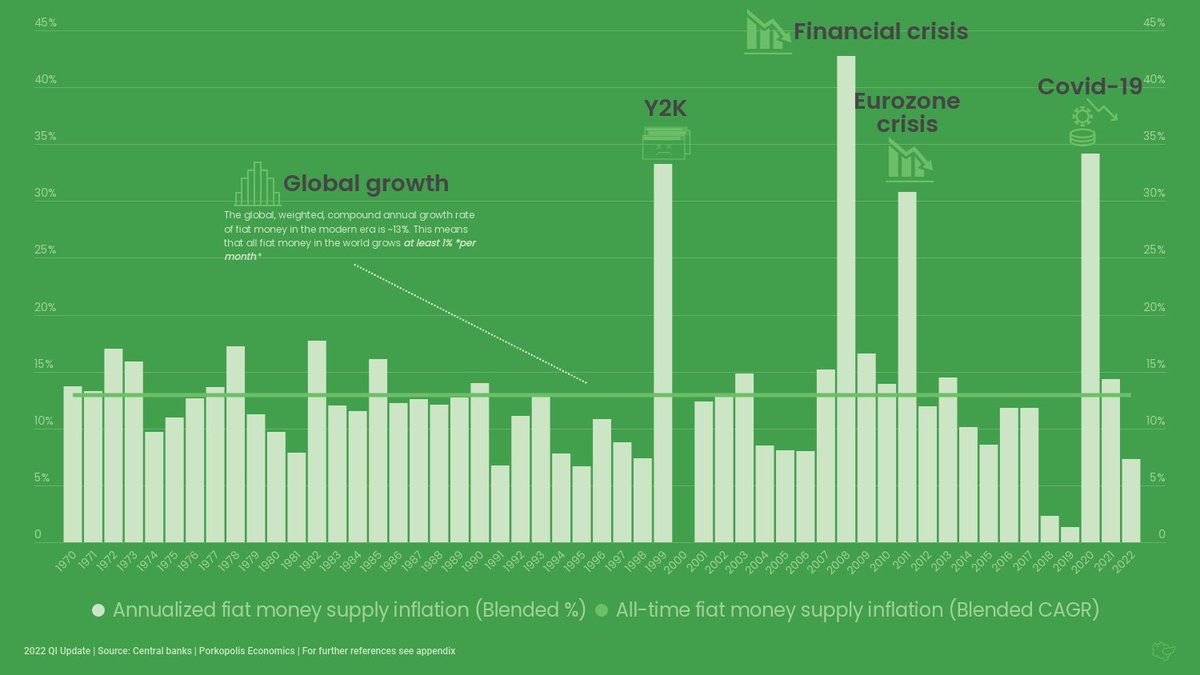
39/ Here we go. This is the trailing 12 month fiat basic money growth. Remember, this is 'unit' growth. % changes in dollars, euros, yen, or won since 1 year ago.

40/ But we need to look deeper. Longer term. Remember the global fiat cash curve? In 1970, the US$ equivalent of global basic money was $200 billion. Today: $30.4 trillion. What does this mean? To understand it, you need to understand compound annual growth.
41/ Compound annual growth is an extremely important metric. It's 'stronger' than a simple, annual growth rate. We can use this rate to understand investment returns, or long-term trends like population growth. We can also derive doubling time from this figure.
42/ Here each bar will represent a *compounded, annual* growth rate, since 1970. If the series data wasn't available in 1970, you will see its start date in parentheses. Note the global *weighted* average. It's about 13%. That is more than 1% growth per month.

43/ This chart will net the same result, but shown differently: the doubling rate for each currency. It's derived from the exact same compound growth in the prior slide. Generally, instead of a *shorter* compound growth rate, you'd want a *longer* doubling time for your money.

44/ Alright, now let's combine all the currencies and look back in time at a blended average since 1970. Basic money. 50+ years of data. Notice the overall 13% CAGR matches the weighted average we've already seen.
45/ Now let's take a look back in time at the growth rate of the global gold stock. Remember, this is the actual ounces-upon-ounces that come out of the ground. Quite a different picture from fiat money. Gold has grown at ~1.8% per annum, in fact, for the last 170 years.

46/ And here's argentum. Notice the overall compound growth rate for silver is less than gold's. This is because historically a larger mass of the white metal was required to match gold's value. That larger base in the denominator means a smaller all-time growth rate.

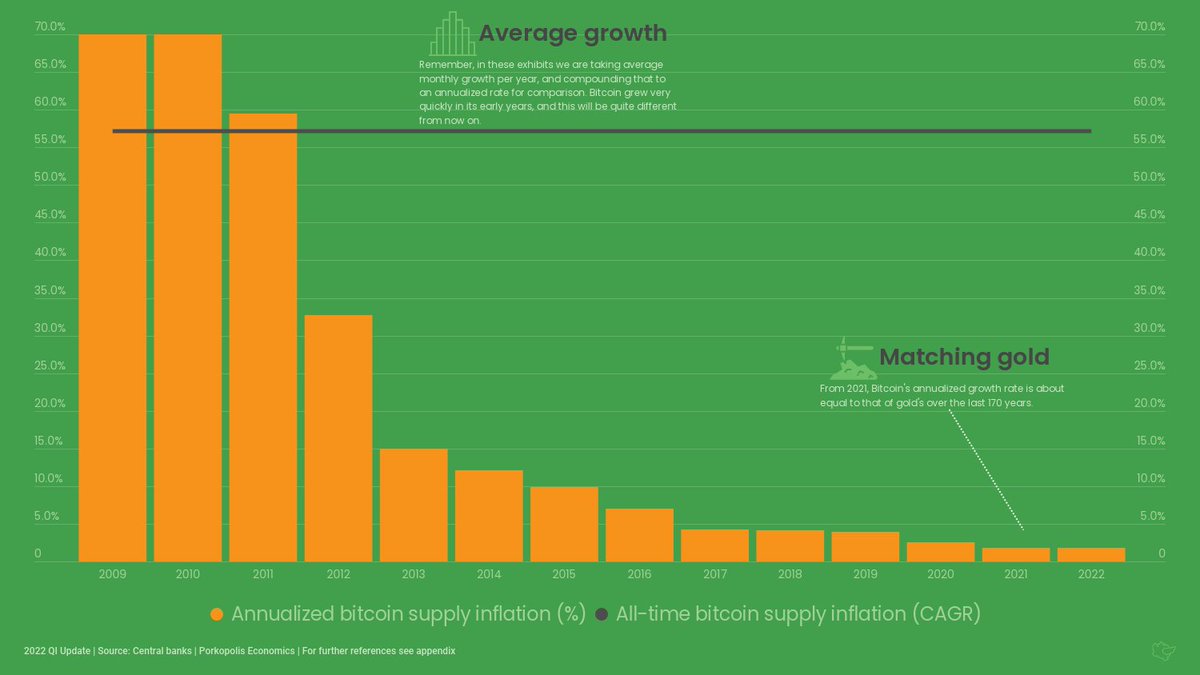
47/ And now Bitcoin. Bitcoin is a different beast from any prior type of money. Though the supply of bitcoins grew rather quickly in the early years, from 2021 it is growing about as fast as gold on an annualized rate. At the next halving it will be that much slower.
48/ Now let's review everything. Here is where the interesting characteristics of Bitcoin's issuance come to light. We know 91% of all bitcoins have been mined, and we know the future issuance of the protocol. This is unlike any other type of money.

49/ Hopefully this will make it easier to understand how Bitcoin's supply works. From 2009 until now, yes, 50 bitcoins grew to 19 million. That's a ~57% compound annual growth rate, or doubling every 1.5 years. But, from now until 2141… that's when things get interesting.
50/ Notice how the supply of bitcoins will only grow at 0.1% per year, or double every *800+ years.* And it gets even more unique, as the Bitcoin protocol won't allow that doubling to happen, as it's supply will cap at 21 million in ~2141. No money in history worked like this.
51/ Alright. Now that we've seen all the data, let's finally take a quick look at some price chat, because even though I told you none of the above covers prices, I know you're wondering how all of this monetary inflation affects prices.
52/ Milton Friedman said, 'Inflation is always and everywhere a monetary phenomenon.' He meant price inflation (again, not graphed above) always and everywhere follows money inflation (very much graphed above).
53/ The rub is it is impossible to predict how and when price inflation will happen. Impossible to predict, hyperinflations or otherwise. The best we can do is measure the money supply and its growth, and be cautious for the way it trends.
54/ But we can say this: If governments keep issuing currency units, and if there is no or a lesser increase in the demand for that money, then ceteris paribus, prices will rise. Ceteris paribus, a growing base money supply will always undermine that money's purchasing power.
55/ These are some of the reasons why the market chose hard money like gold & silver. Always emergent in human action, unless there is fiat monopoly intervention, the market will decide the best money. If aliens in a one-off whisked away our gold, we'd choose the next best.
56/ Let's take one more detour back to the dollar and the USA specifically, to see why it matters to track the growth of the monetary base (the *money*), versus the growth of other economic stuff. You know how they tell you the bad stuff should only grow at 1-2%...?

57/ First, in the last 20 years the supply of basic money grew 11.7% per year, or doubled every 6 years. The Fed's mandate is to control inflation and keep people employed. GDP would be one way to measure economic health. How fast did it grow? Only 4% per year.
58/ In 2000, $1 of basic money printed got you $17 of GDP. Now? The same dollar print gets you only $3.85 in GDP. In 2000, 1% of unemployment would cost you $89 billion. Now? $864 billion for the same 1%. And... government debt grew 8.2% per year as well, doubling every 9 years.
59/ Population only grew 0.8% per year, yet base money grew 11.7% per year. So on a per capita basis you're 11.7% - 0.8% = 10.9% growth in base money. That's a doubling rate every 6.7 years.
60/ And continuing, we can start to see why measuring 'price inflation' is hopeless. Gold valued in dollars? Grew 11.5% per year. Stocks? 8% per year. Bonds? Only 4.2% per year. Bonds (specifically the gov't variety) are return-free risk, not the colloquial opposite.
61/ One more way to view all this. Again, understanding compound growth is key. This curve is mathematical. Everything will fall on it, based on its compound rate. Einstein said compounding is the 8th wonder of the world. This is why. What is your preferred monetary asset?

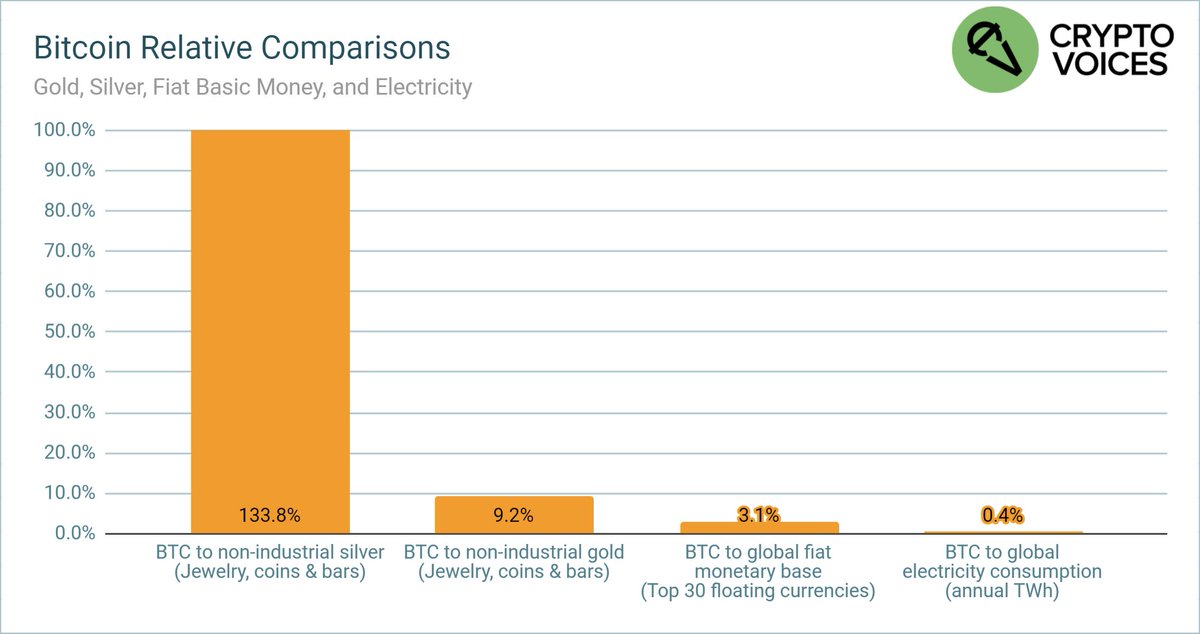
62/ Here's another way re: #Bitcoin against its peers. Gold, silver, fiat cash, and thanks to the good people at @CambridgeAltFin, vs. global electricity (~125 TWh / 23,000 TWh). Note #Bitcoin accretes well faster vs. money than electricity consumption or energy usage.

63/ A few notes before the final summary. Almost done! Remember these are the top 50 currencies in the world over the past 50 years. Zimbabwe & Belarus don't make the cut; as their monetary base is so tiny, their hyperinflations would barely move the needle on what's presented.
64/ For the euro, its accounting creation began in 1999, and it started circulating in 2002. Prior to 2002, we are building a blended euro monetary base back to 1970. As of now, it includes 3 of the very largest: the Deutsch mark, the French franc, and the Italian lira.
65/ To reiterate the *global blended* fiat inflation rate: each country's *native* base money growth % is weighted by how large that base money actually is in US$ equivalent, during that month. This weight evolves as more currencies are added over time.
66/ As we look back in time, for those currencies that weren't established, they didn't factor into that period's global inflation. For example, the USD's weight itself was 35% of the pie in 1970, and only 20% today, as (among others), data on China begins only in Dec-1999.
67/ Regarding compound annual growth rates: they're always calculated from monthly fiat unit growth, then compounded to annual (to the 12th exponent). This is necessary due to cases like Brazil and Argentina, which had 5 and 4 different currencies respectively, since 1970 alone.
68/ Continuing, a compound annual growth rate from a 1970 currency to 2020 currency doesn't make sense for Brazil. So the *monthly* rate must be taken across time and then compounded, ignoring those 6 months when the central bank reset (slashed zeroes) from the old currency.
69/ And finally, the mechanics of this method (compounding monthly growth rates to annual) were of course repeated across gold, silver, & bitcoin's supply curves, for consistency. The only exception is the TTM column in the summary (coming). Simple year-on-year growth there.
70/ Streams coming very soon with more charts, info available at porkopolis.io. More CV pods coming too at porkopolis.io/podcast. #Bitcoin is a real contender as the monetary media of ultimate settlement. We'll be there as its status progresses.
71/ This graphic includes all items. Print it out if you like. Modern history of money. 50 fiat currencies. Gold. Silver. #Bitcoin. Supply-side summary of all the basic money in the world.

72/ Fiat monetary base data sourced from central bank balance sheets, wonderful gold and silver history from industry expert Nick Laird, and bitcoin from @coinmetrics.

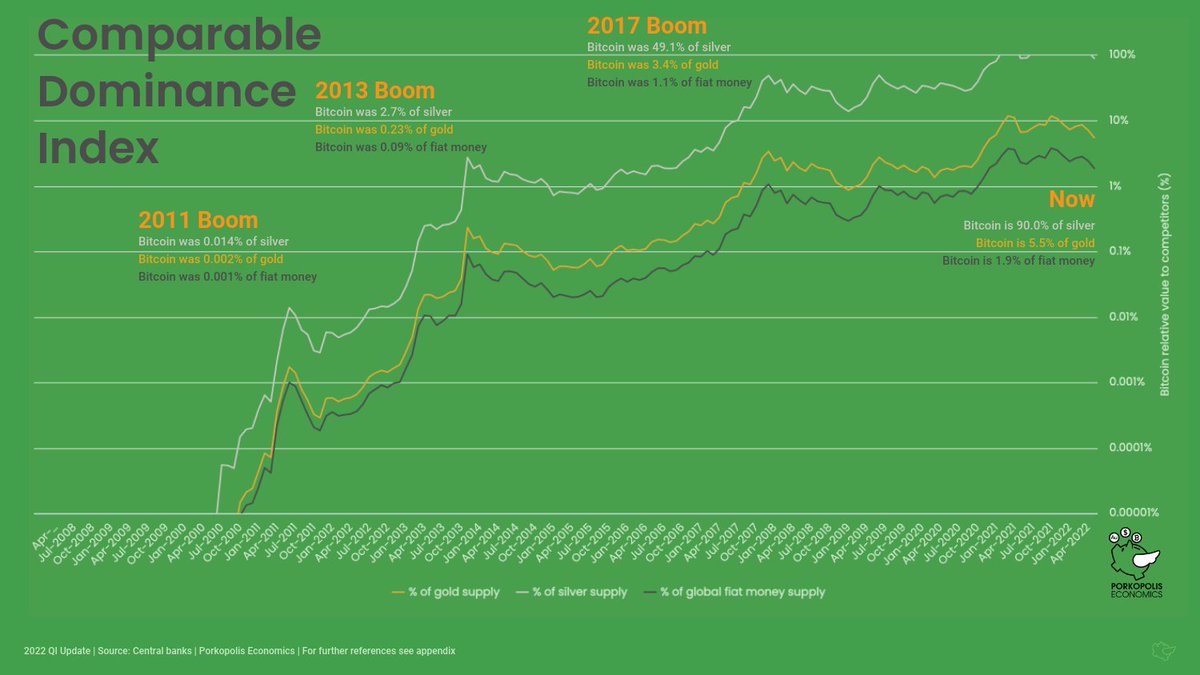
73/ This final graphic lays out #Bitcoin's supply compared to all other basic money, past and present. Bitcoin currently sits at 1.9% of the global fiat monetary system. #RealBitcoinDominanceIndex.
74/ More to come in the future, continuing to work on this topic. Any sats graciously spared for this effort are very much appreciated and help keep up the research. 🙏
Donations in $BTC may be made here: donations.porkopolis.io
Thanks for reading.
/fin
Donations in $BTC may be made here: donations.porkopolis.io
Thanks for reading.
/fin
Addendum. The slides in tweets 13, 21, 39, 42, and 43 have mega detail and some was cut off during compression for the image export. Here are the full slides with all the country detail! 🙏


...and tweets 39, 42, and 43.


• • •
Missing some Tweet in this thread? You can try to
force a refresh