Casey Profile picture
Jun 14 5 tweets 3 min read
#tradingtips Here’s my simple way of picking which stock to trade

This will help get you out of the “chop” and on the winning side of the move!

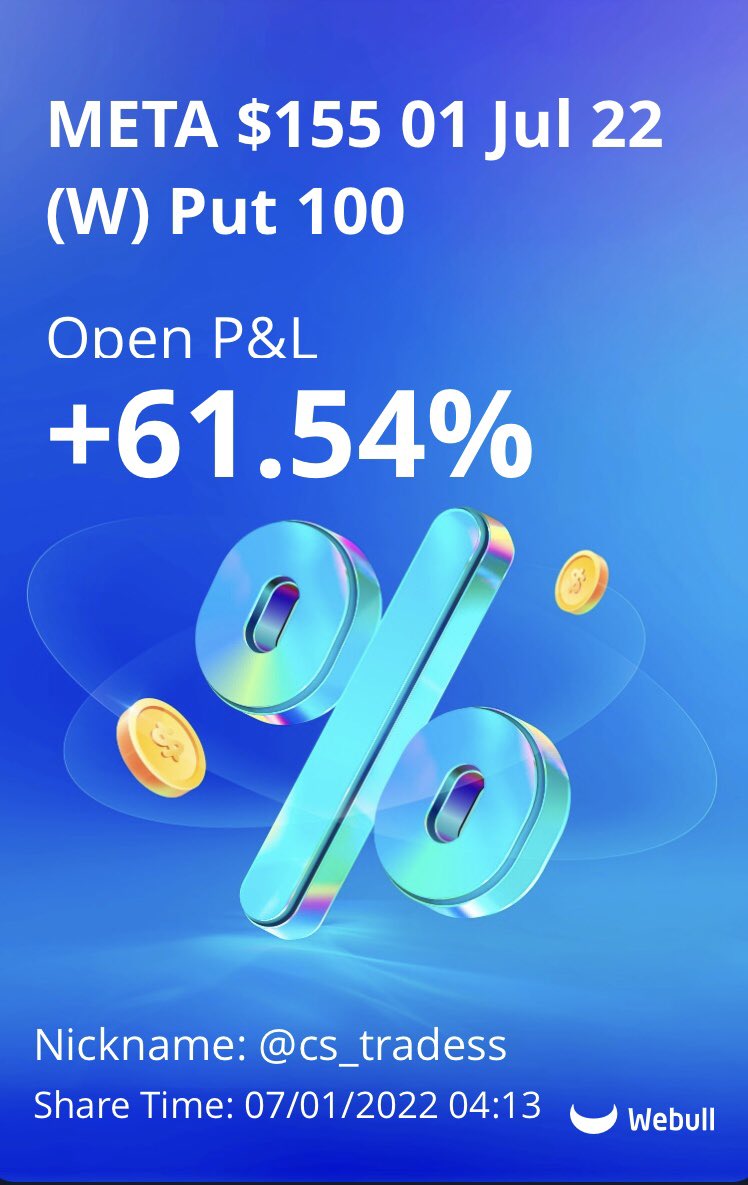
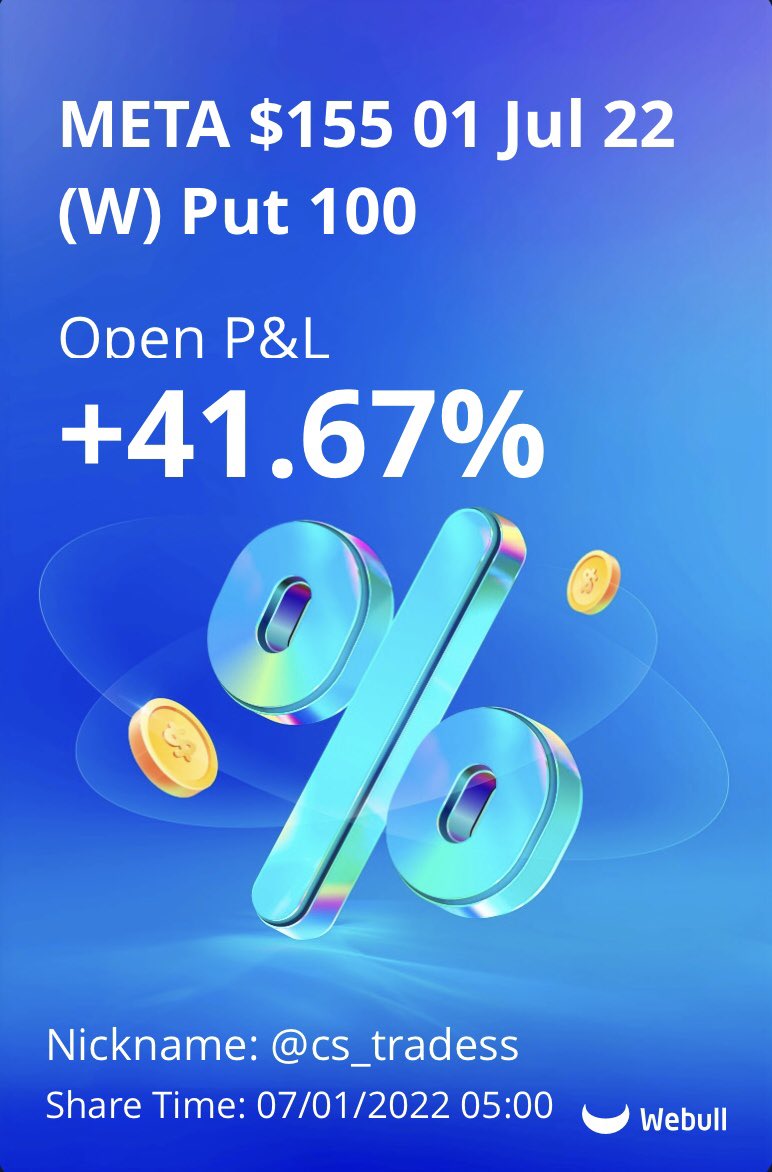
Let’s take a look at todays price action and show you how we nailed this amazing trade to start the week👇

$spy $qqq $iwm $nvda $amd ImageImage
I start with 4-8 familiar names.

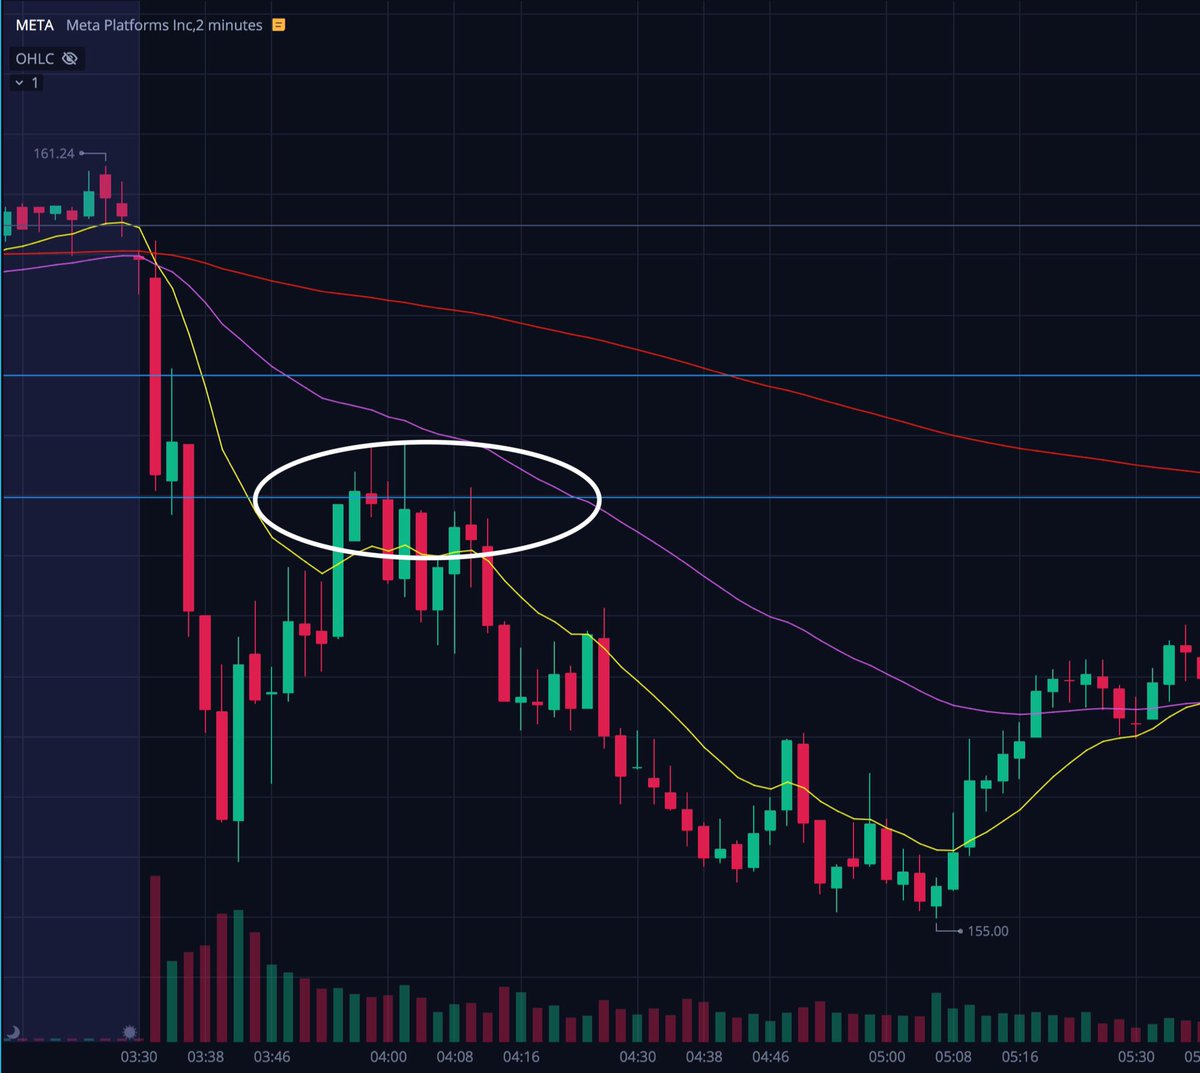
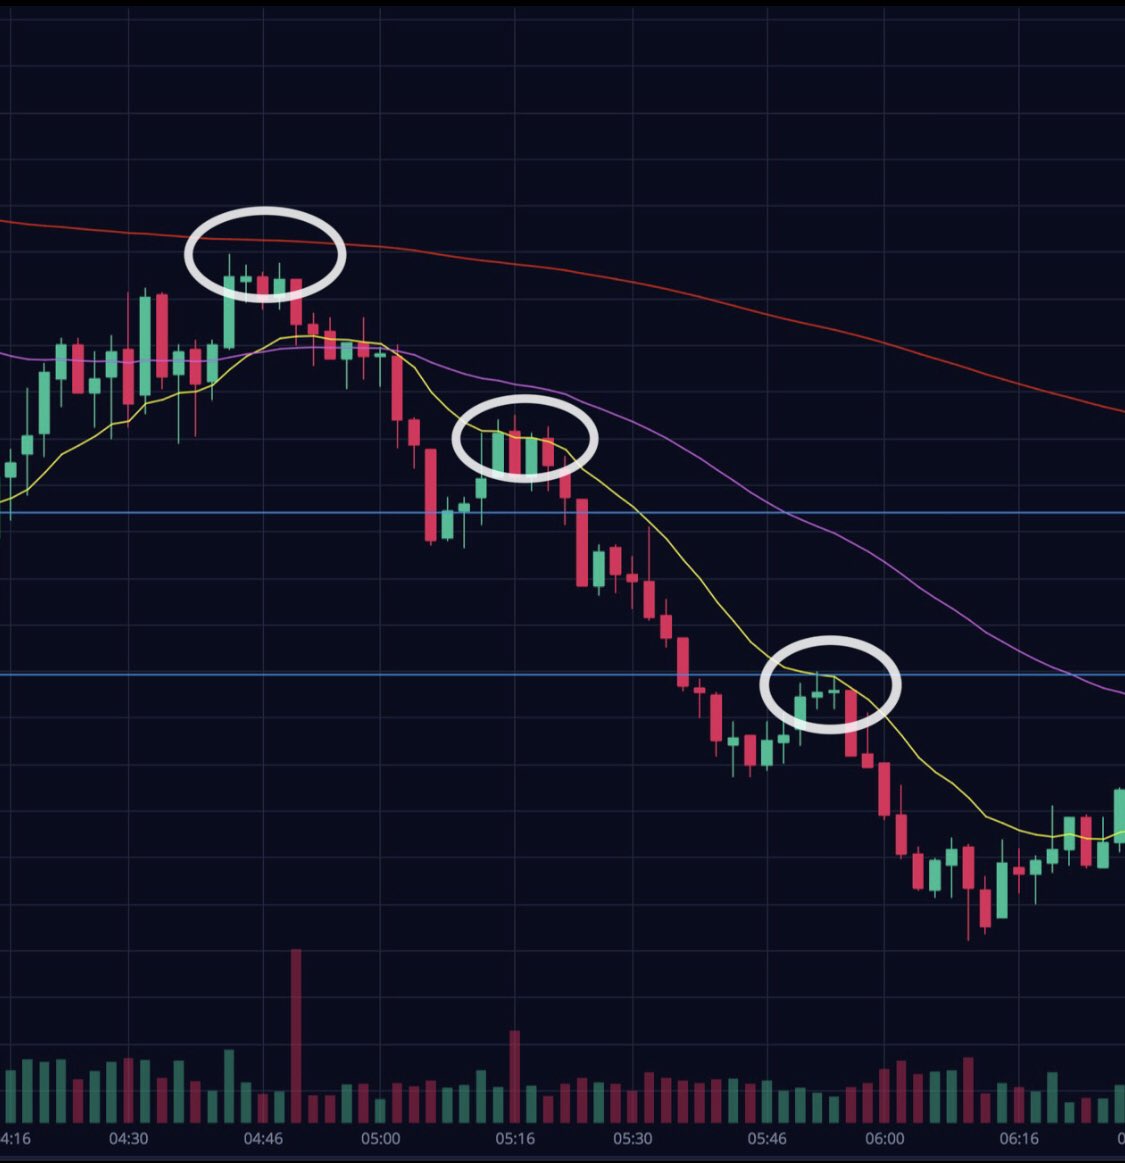
Stay patient! watch for a decent trend to present itself. Without a trend there is no pullback/dip buy, so relax and wait for it. There’s no rush

Entering before a trend has formed means you are predicting price action rather than playing off it
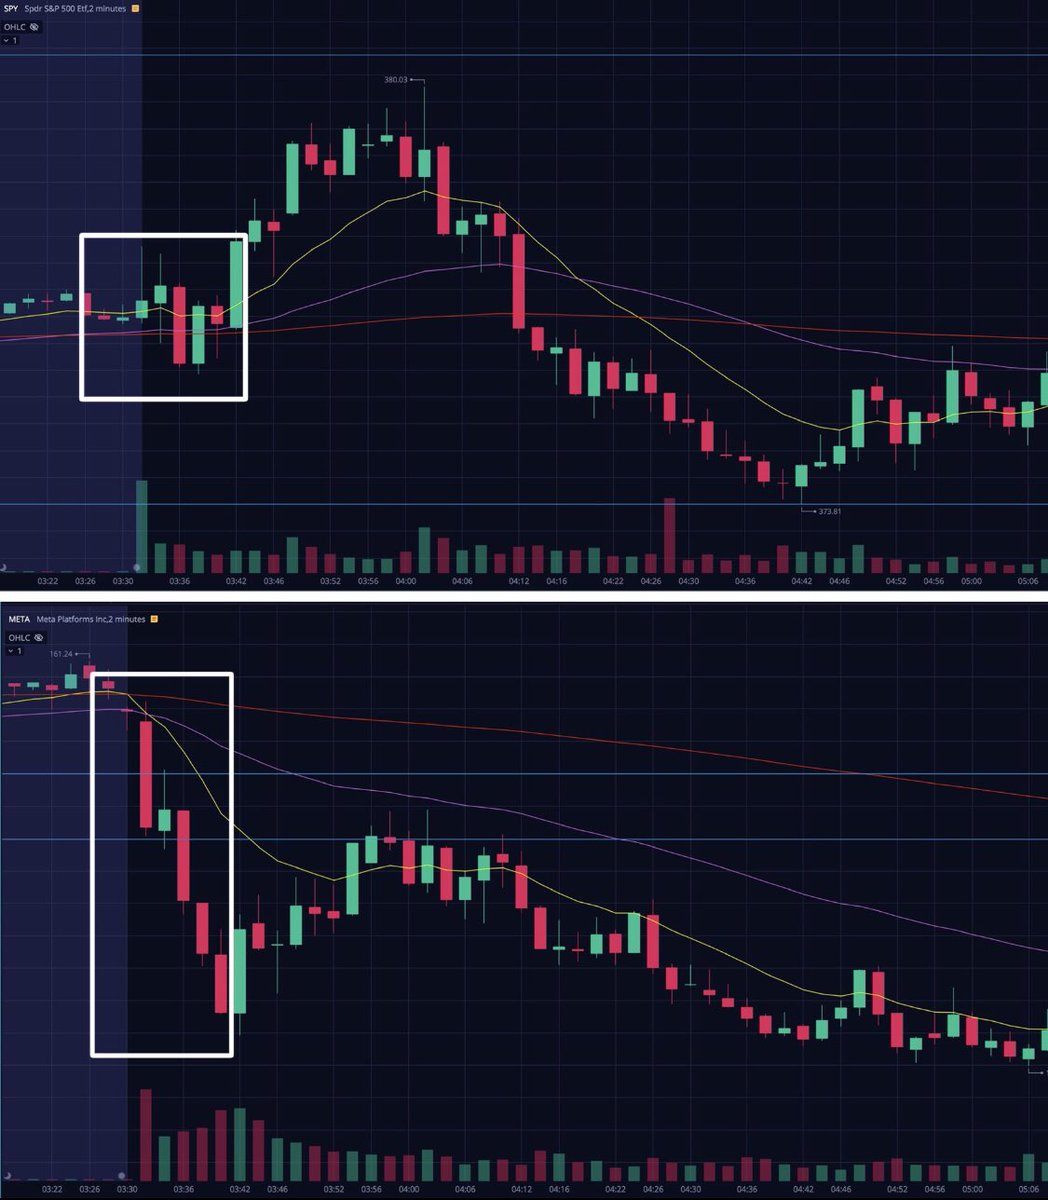
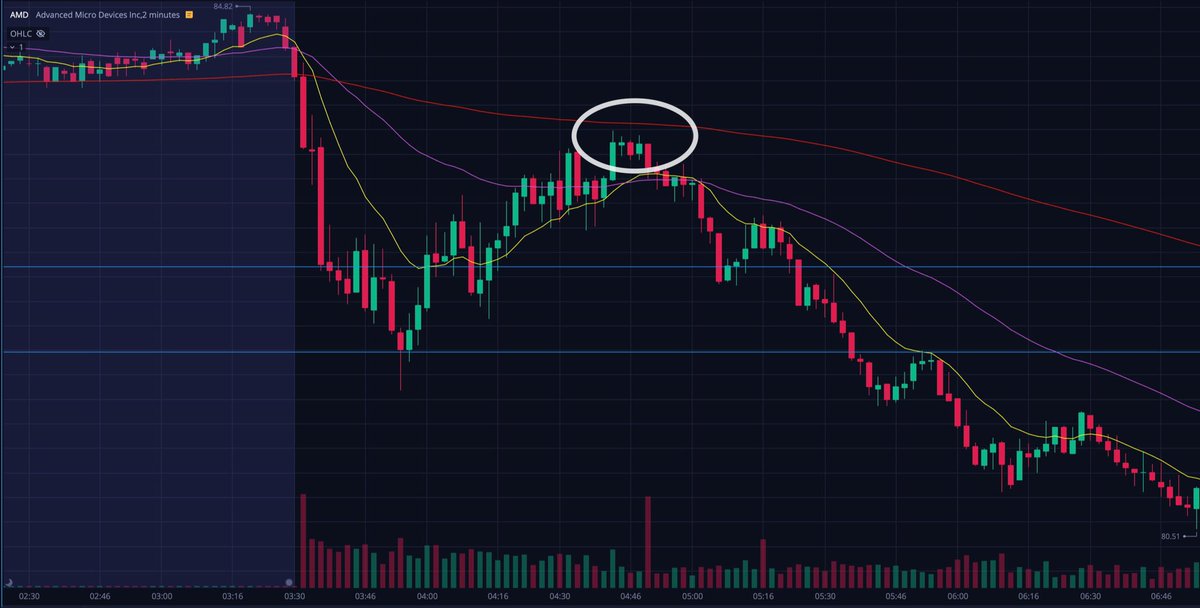
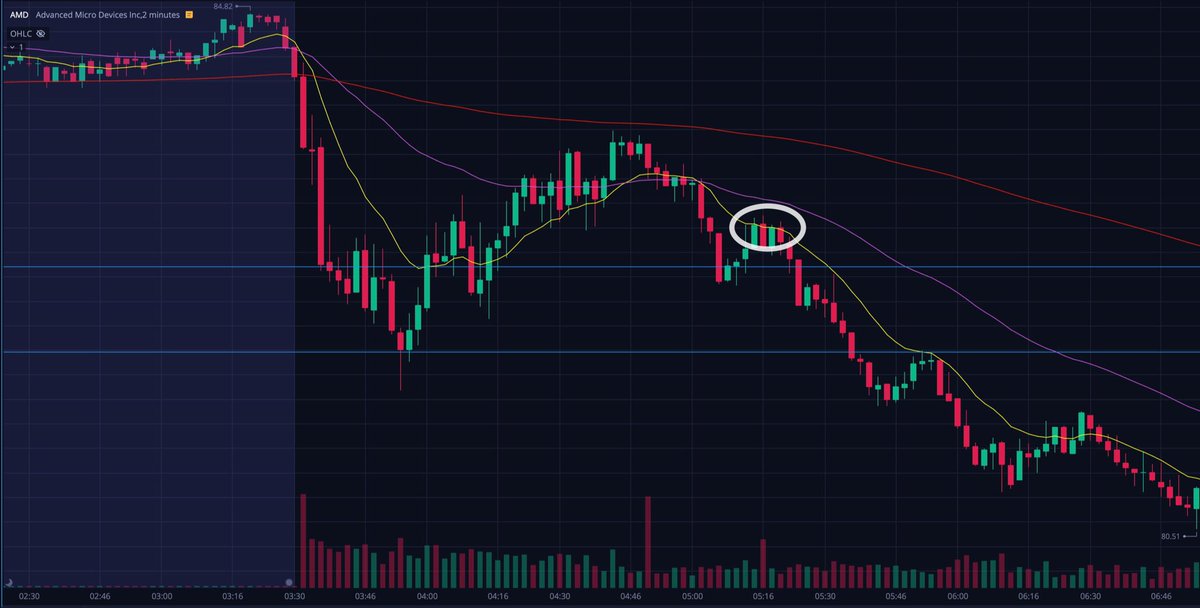
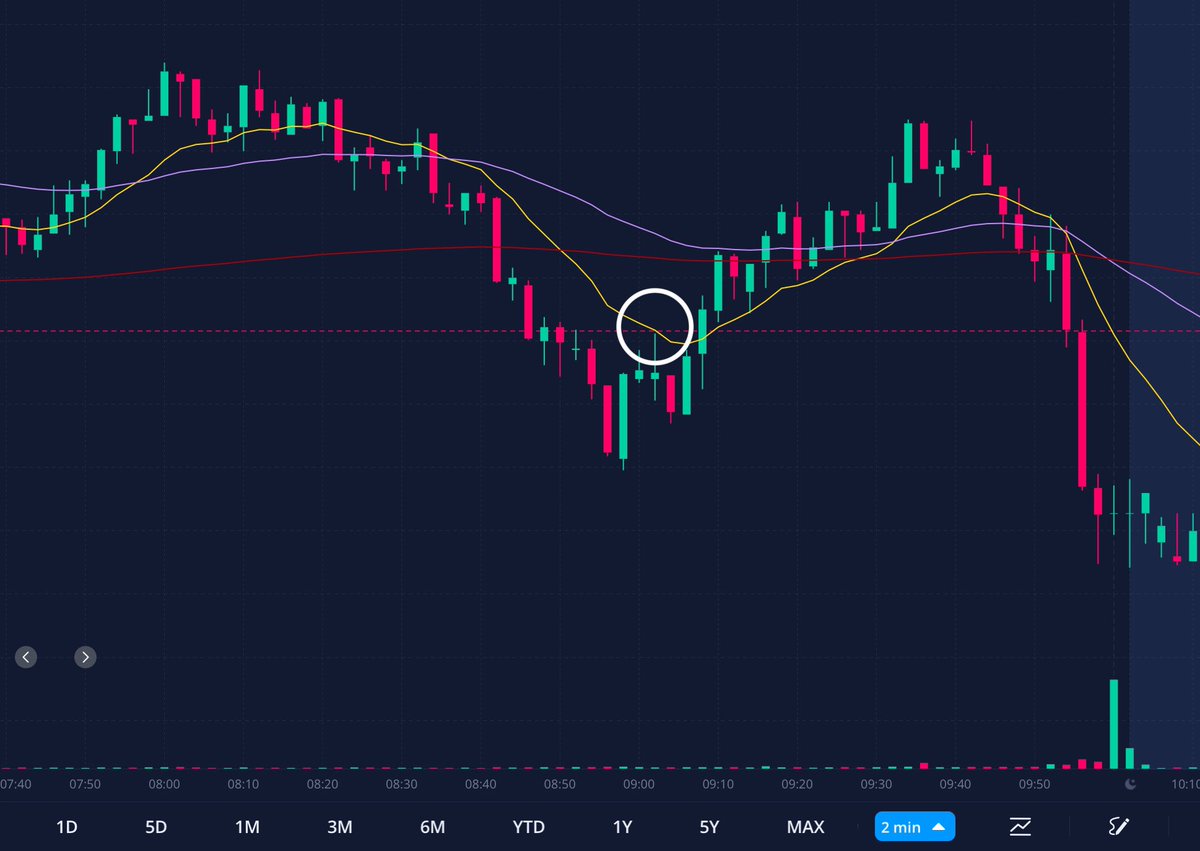
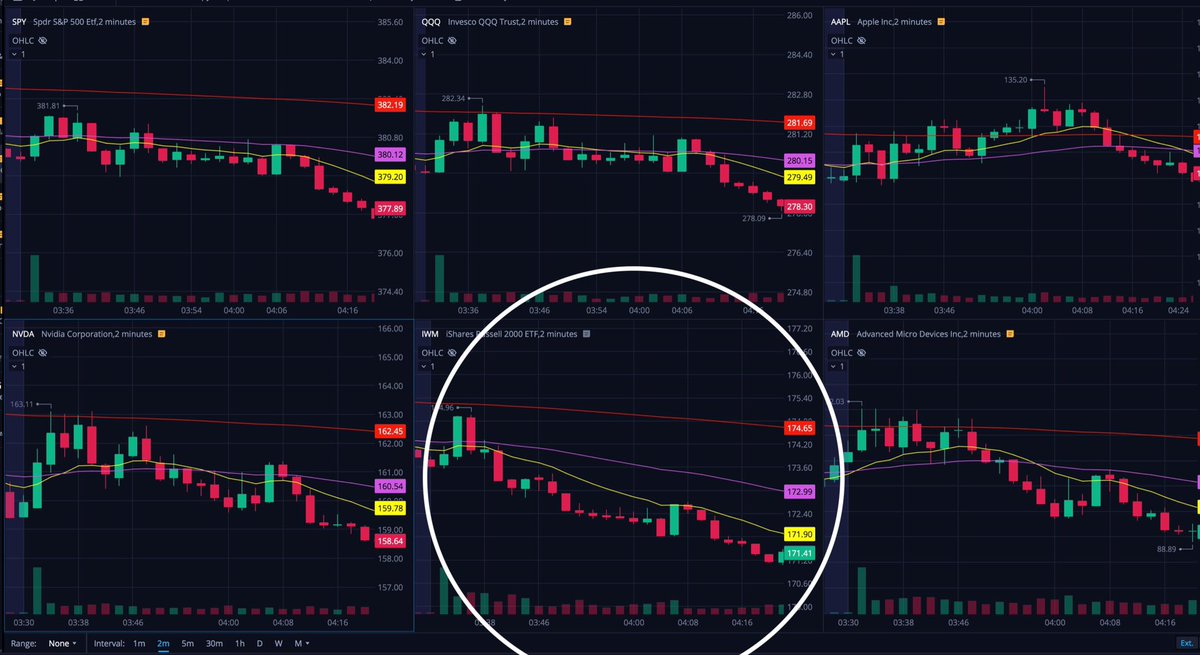
Look at the first 30 minutes of todays price action. Note the emas. $spy $qqq $nvda $amd all flat/choppy! There are no dip buys on flat price action.

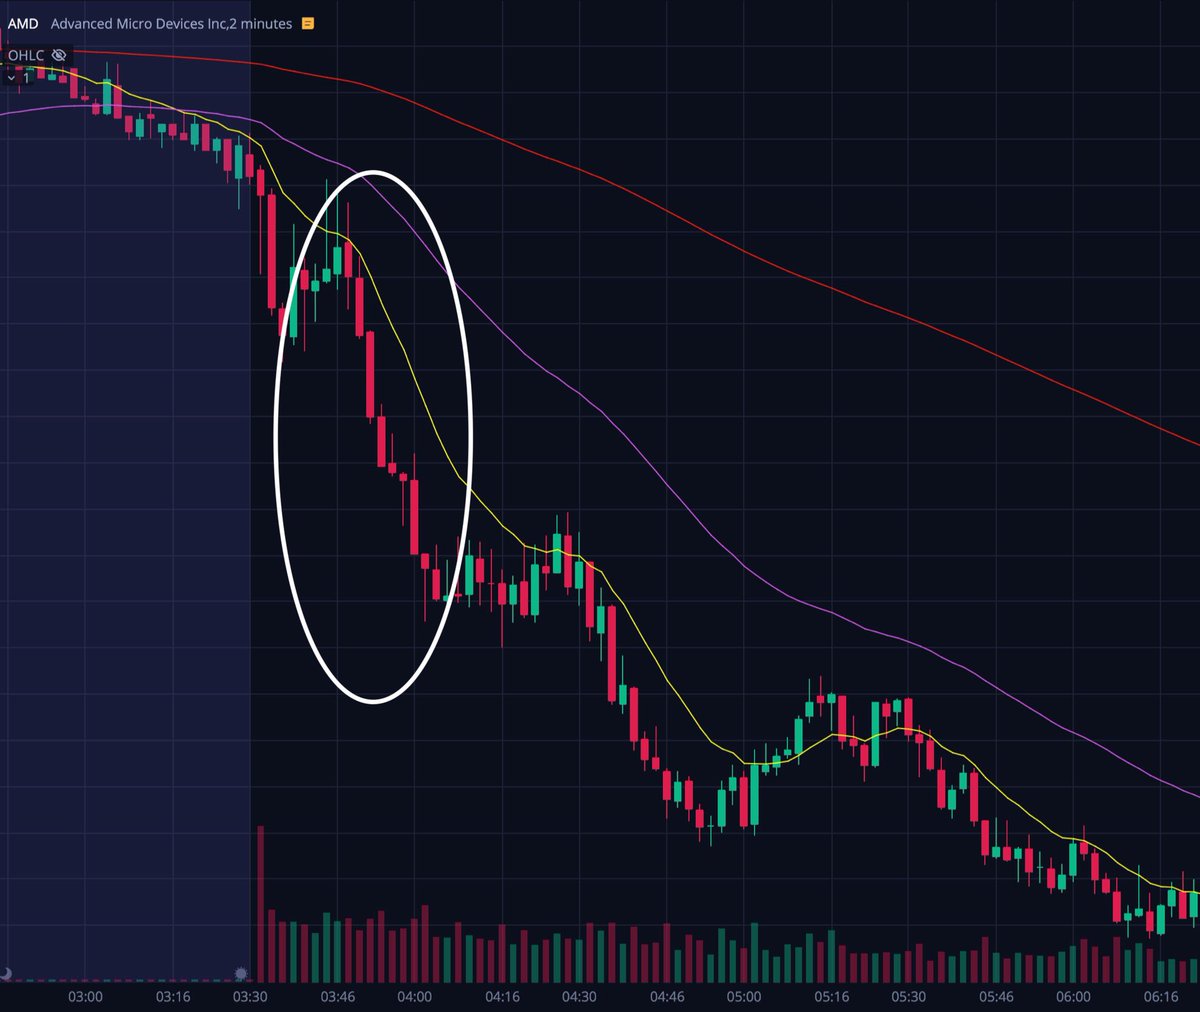
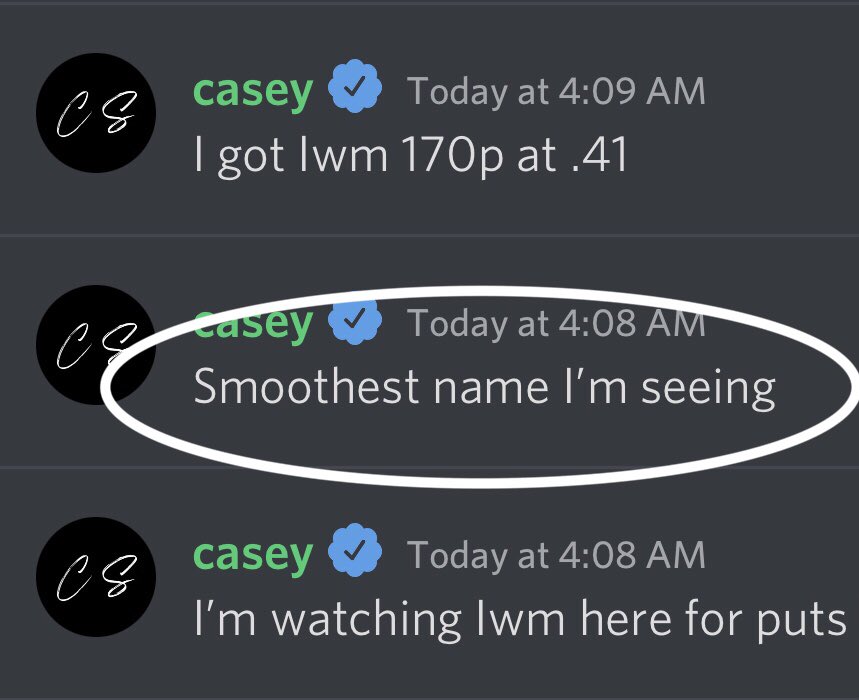
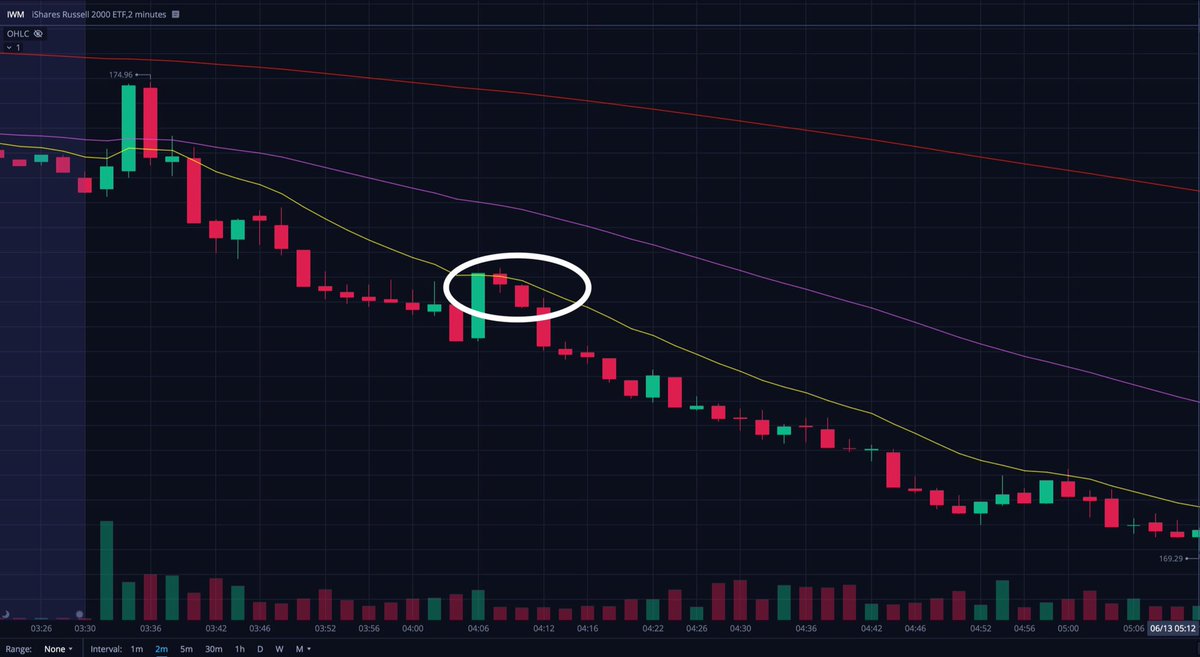
Now look at $iwm, the 13ema is drifting smoothly away from the 48. This is what the start of a nice trend looks like Image
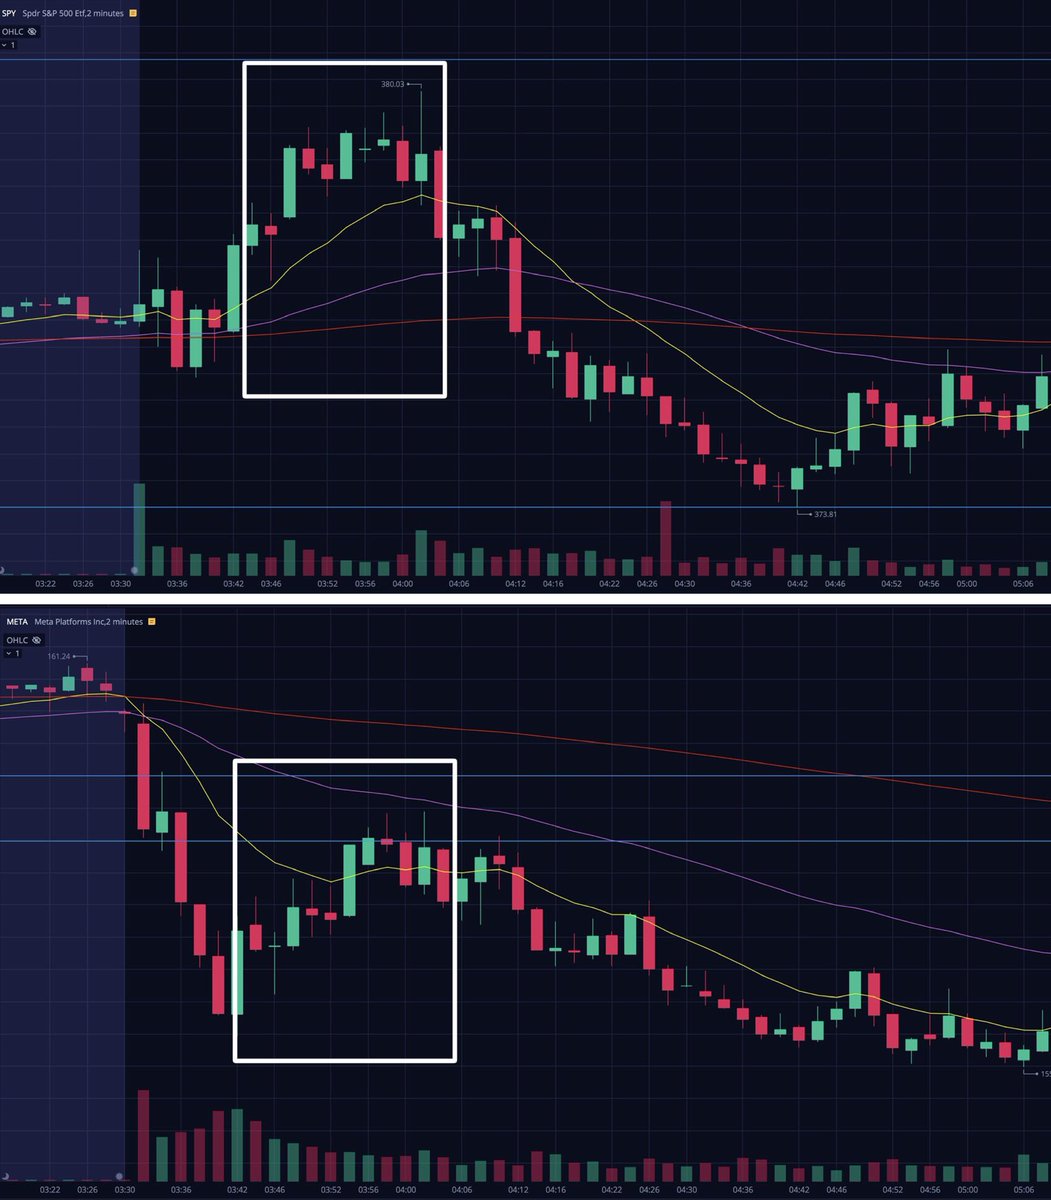
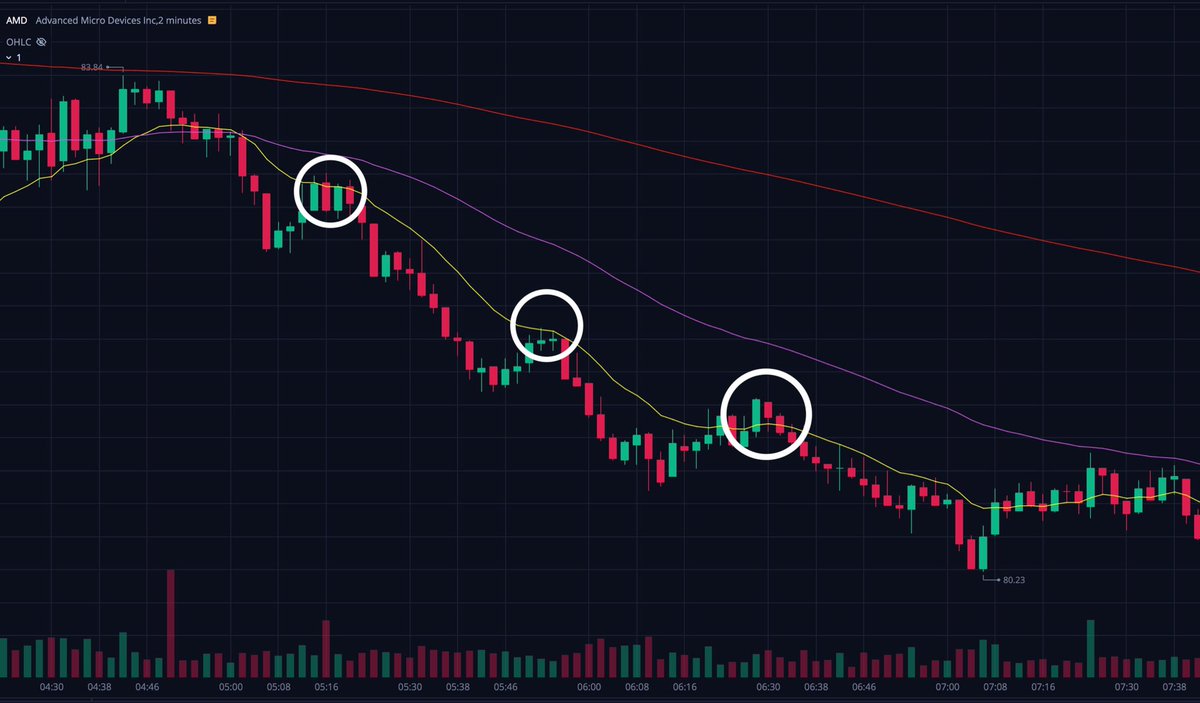
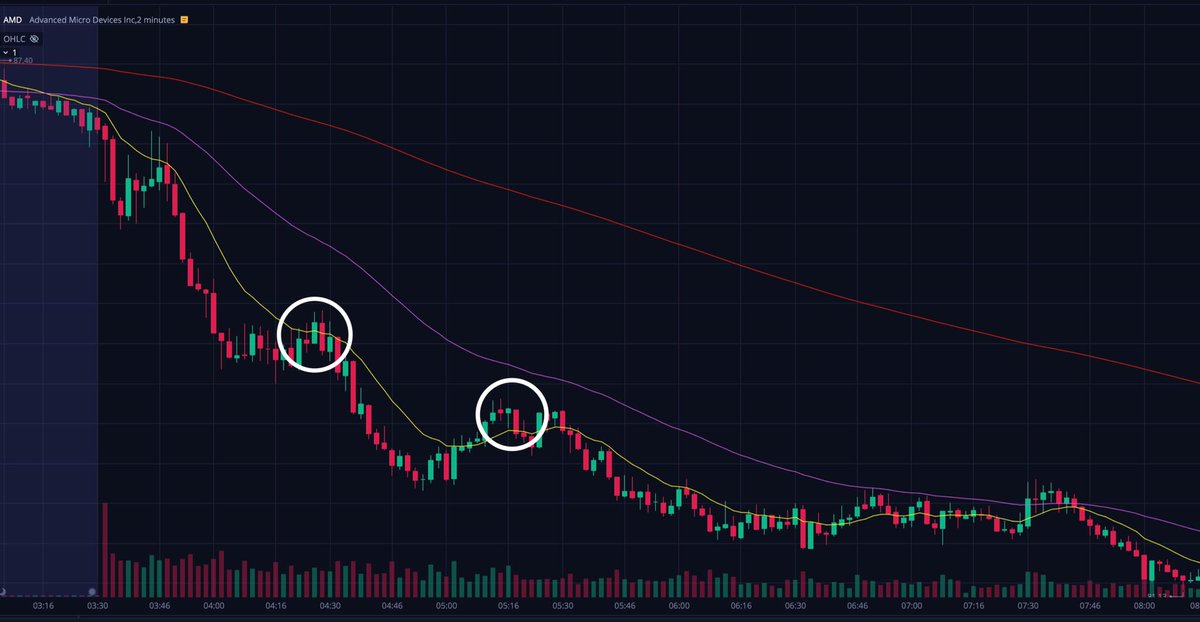
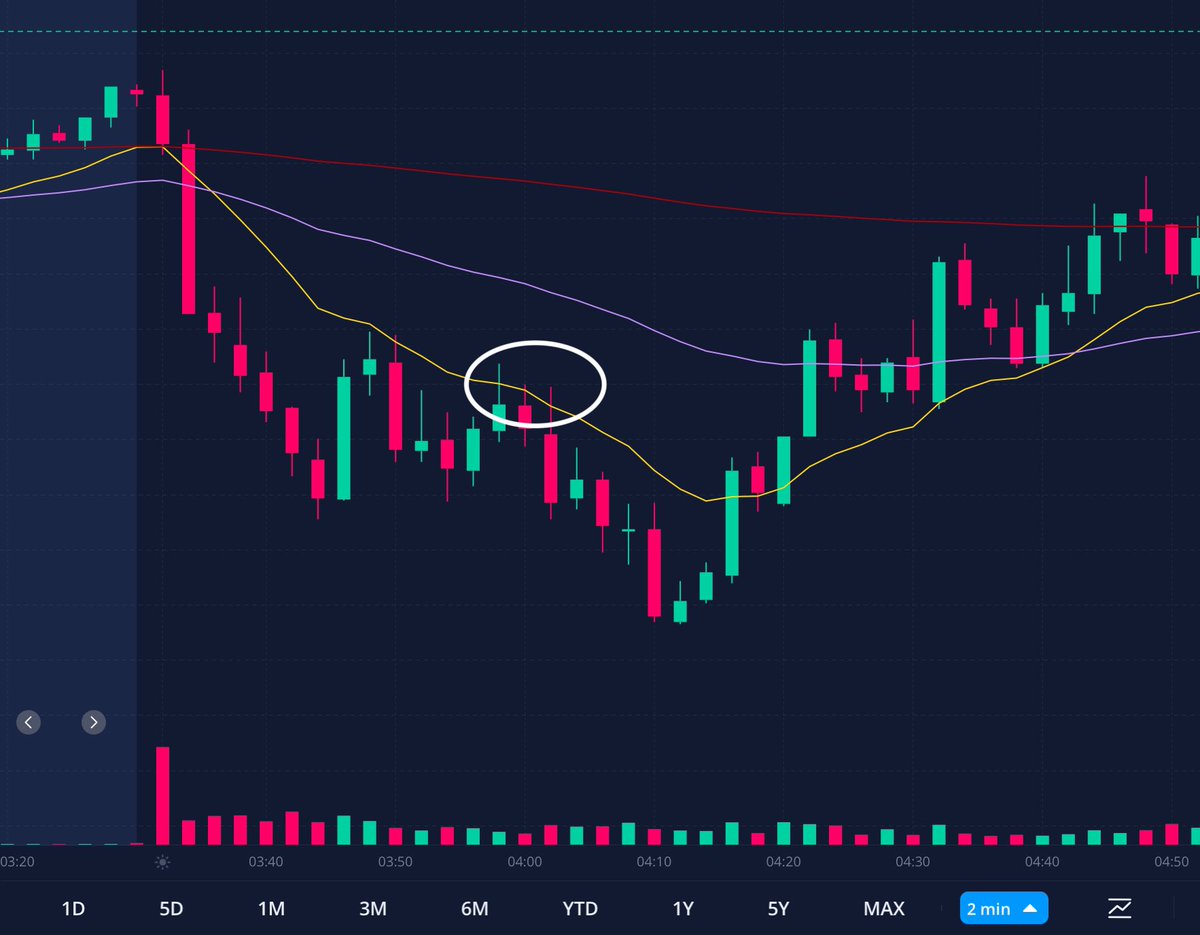
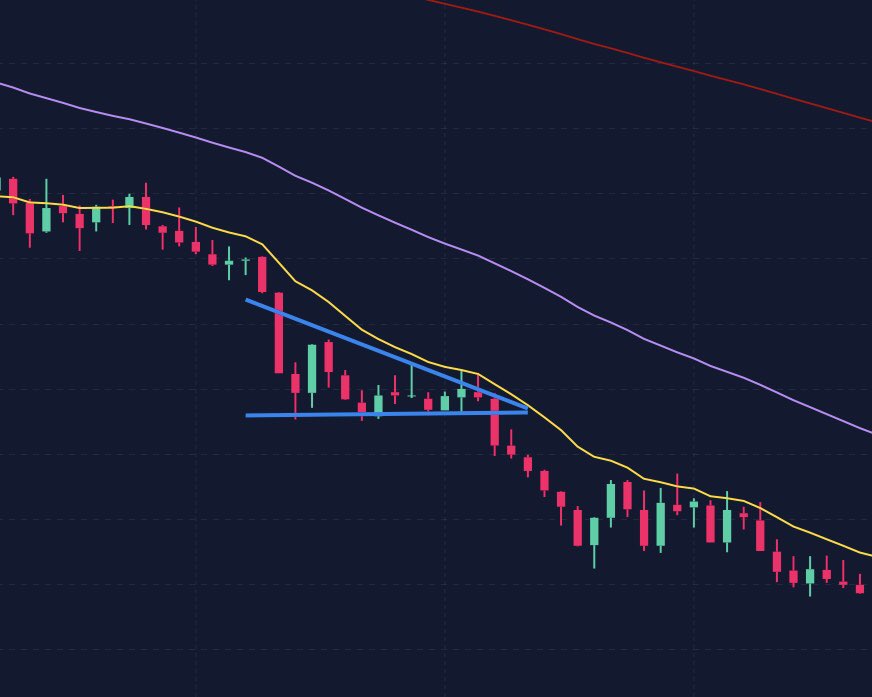
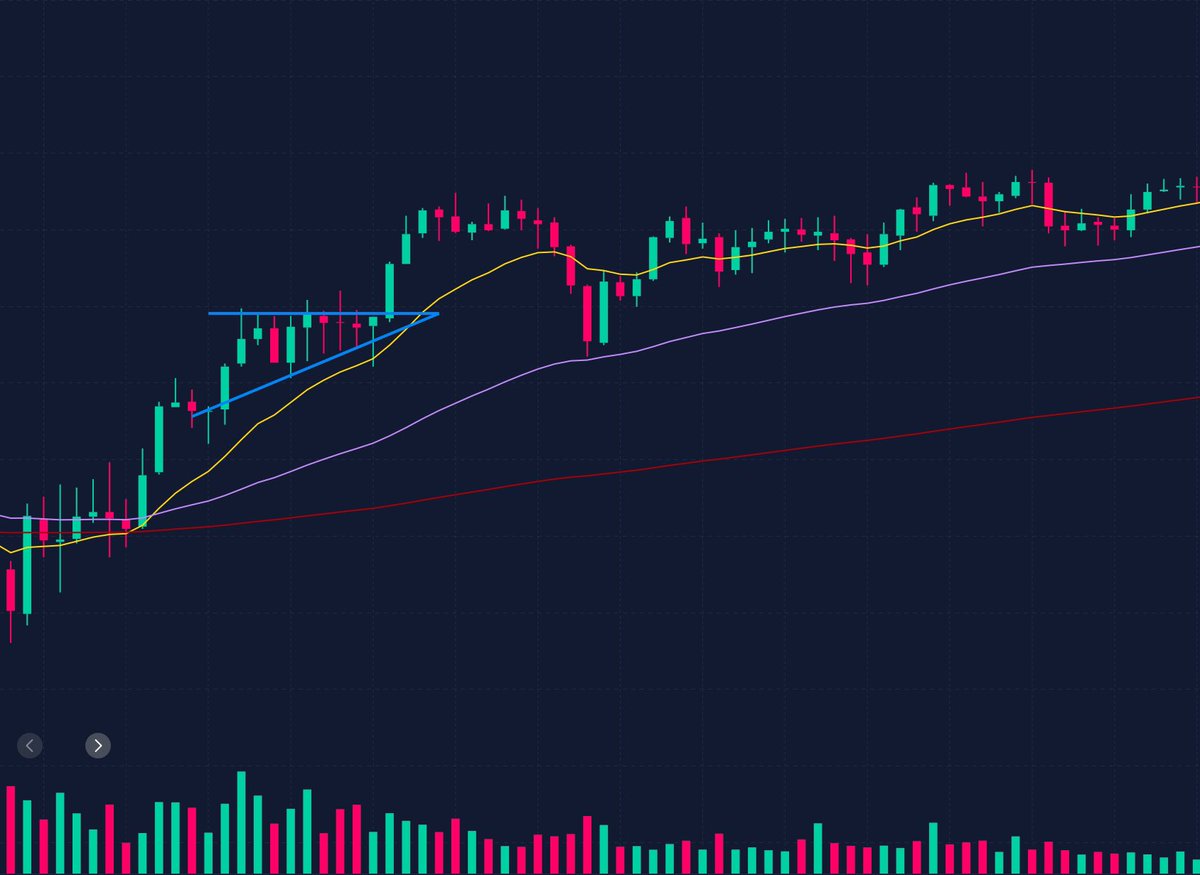
Now you have a stock with a decent trend to focus on, time to start focusing on your entry point. A pullback to the 13ema is that spot for me. Get in and ride the trend by trailing your stop Image
Watch a few of your favorite stocks✅

Focus on the one that has a decent trend✅

Buy the pullback✅

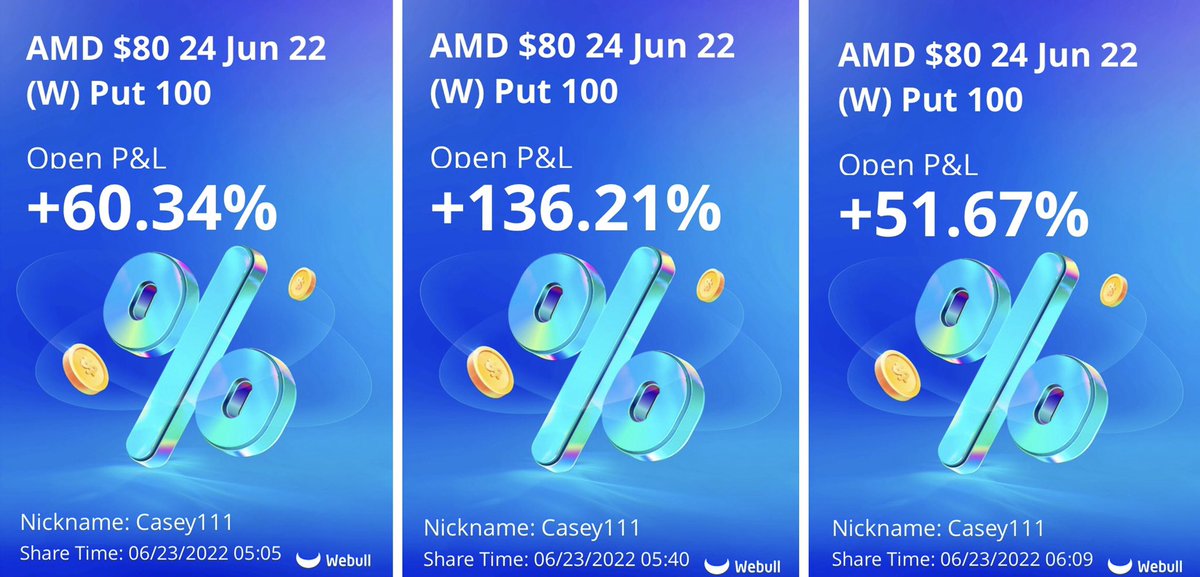
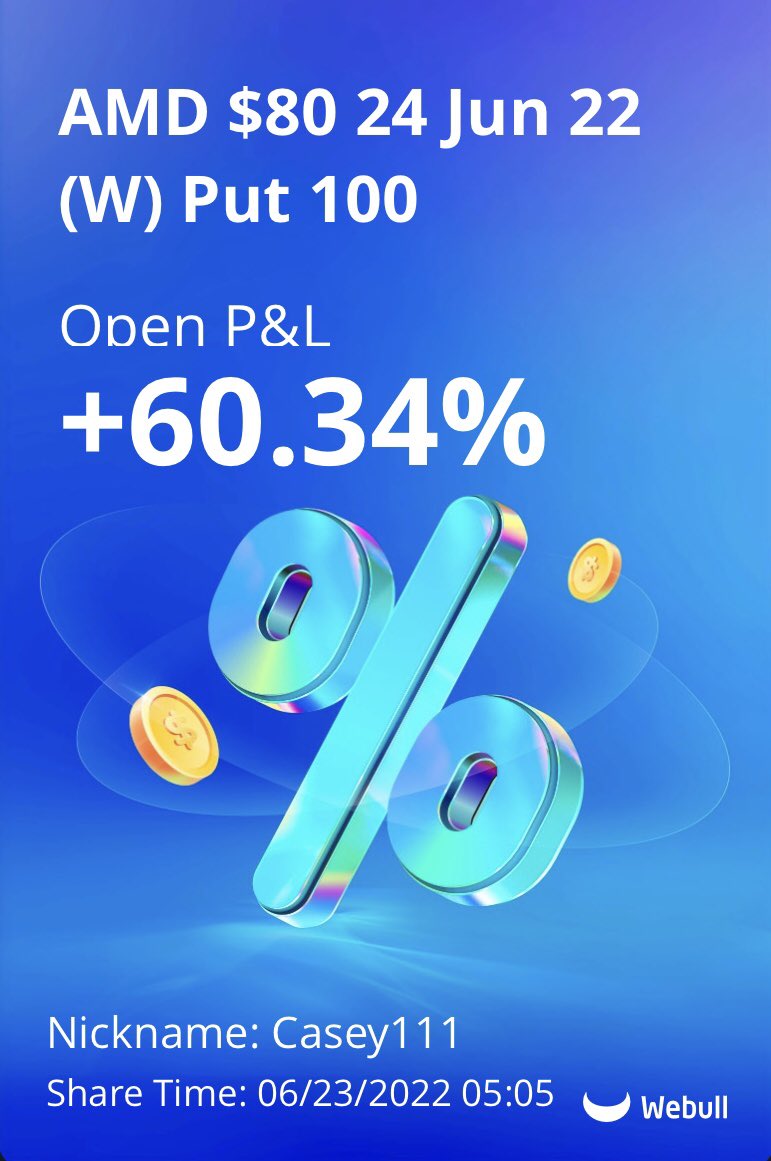
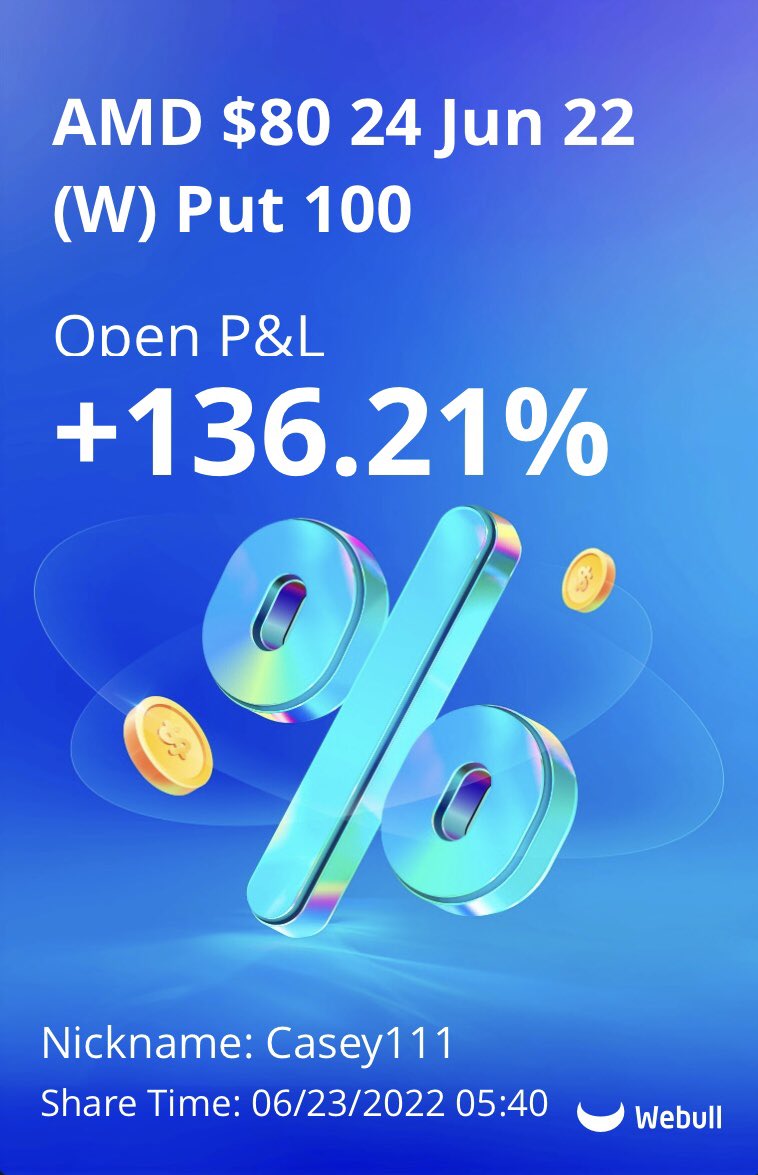
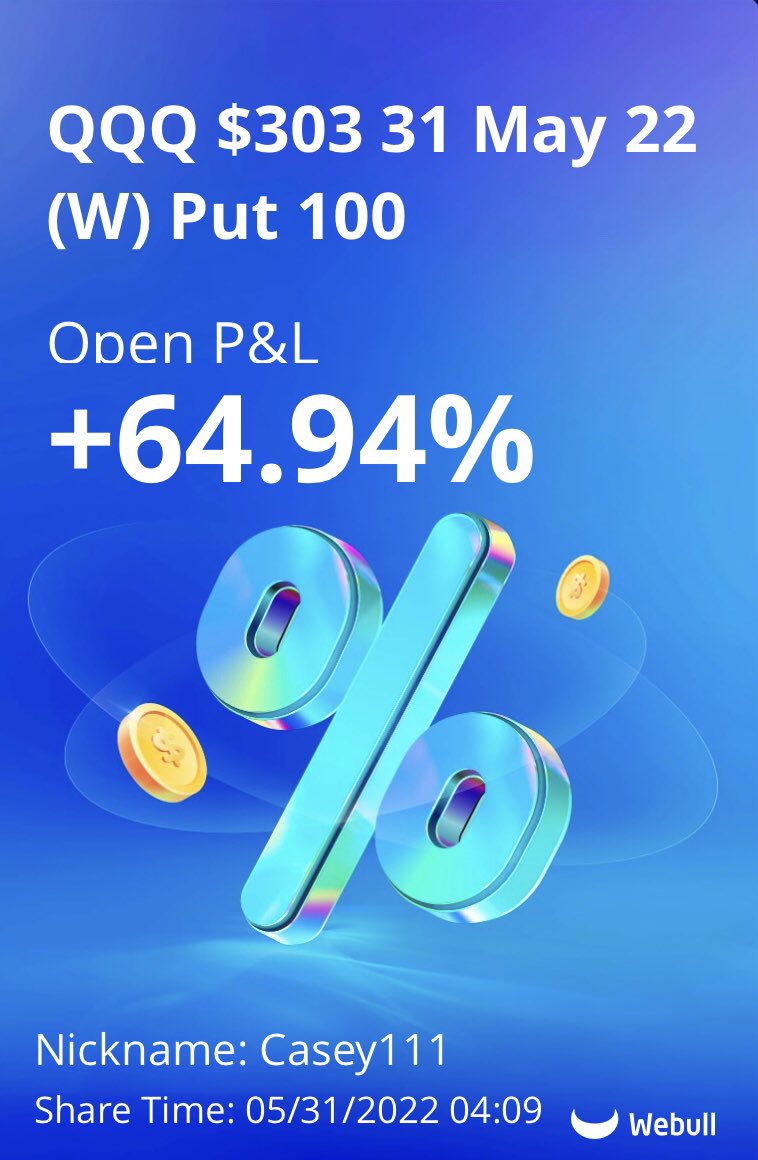
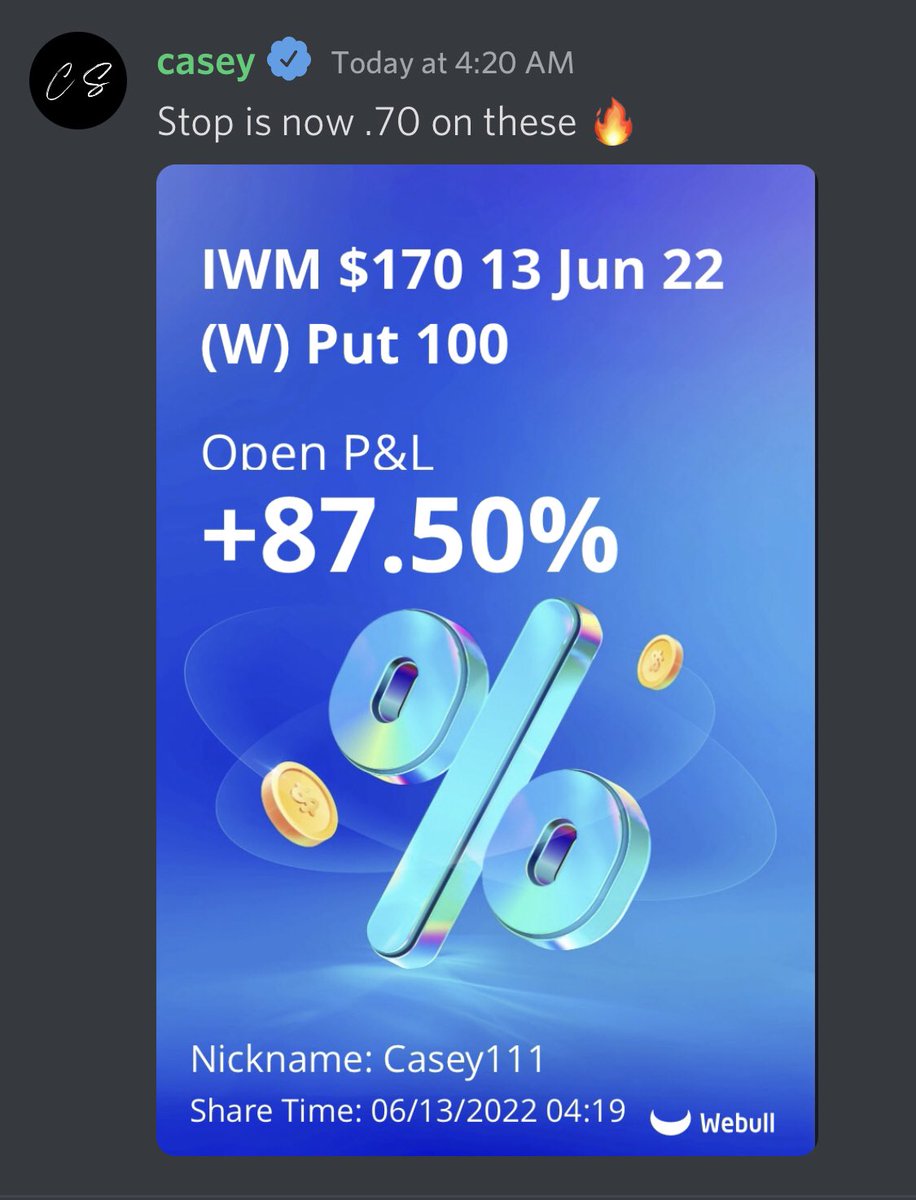
First trade on Monday morning and the team is already banking! That’s how you start the week 🔥 ImageImageImageImage

• • •

Missing some Tweet in this thread? You can try to force a refresh
 

Keep Current with Casey

Casey Profile picture

Stay in touch and get notified when new unrolls are available from this author!

Read all threads

This Thread may be Removed Anytime!

PDF

Twitter may remove this content at anytime! Save it as PDF for later use!

Try unrolling a thread yourself!

how to unroll video
  1. Follow @ThreadReaderApp to mention us!

  2. From a Twitter thread mention us with a keyword "unroll"
@threadreaderapp unroll

Practice here first or read more on our help page!

More from @cs_tradess

Jul 2
Finding #stocks that have relative strength or weakness early is a huge help in trading!

Let’s take a look at these $meta trades from today as an example of how to find one to trade 👍
$spy $qqq $amd $nvda $iwm ImageImage
I find weakness and strength on individual names by comparing them to the overall market or $spy, take a look at $meta off open. The first 10 minutes of trading it’s going straight down, slamming right through pm low, while spy is going sideways. This is a huge sign of weakness! Image
Next we see $spy start to rally, this brings $meta up through the 13ema to the first level of resistance I am watching which is yesterdays low of day. Any sign of weakness in the market at this point and meta is toast! This is where I start to look for an entry into puts ImageImageImage
Read 5 tweets
Jun 26
The 2 worst mistakes that traders make are

1-Going against the trend

2-Chasing breakouts

In this thread I want to take a look at how we can fix both these mistakes and get your account back on track 🤙

$spy $qqq $amd $meta $tsla
The first step to keep yourself from going against the trend is knowing the difference between a healthy pullback and a reversal

I use the 2 minute ema strategy from my page to gauge this

The circled areas here are pullbacks for you to enter and join the trend, not reversals! ImageImage
Seeing a massive sell off like this on $amd most traders think the best play would be chasing the first green candle for reversal. Perfect example of fighting the trend

But If you use the ema strategy your first thought is look for the 13ema pullback to buy and join the trend ImageImage
Read 6 tweets
Jun 23
Finding trends like this one on $amd today are my main focus when trading. Here’s how I play them for maximum gains and minimal risk! Check it out 👇 ImageImage
My first entry was off the 200ema resistance (red line)
The 200 was nice support in premarket so now it was serving as nice resistance once it broke. My first target was the premarket low level ✅ ImageImage
My second entrance came after the pm low bounce. Seeing it hold the 13ema here is a great sign of a trend about to form. My next target was a big move to a new low of day ✅ ImageImage
Read 5 tweets
Jun 19
A few people asked if I could show more examples of chart patterns. So let’s do it!

Here we go, common chart patterns on REAL charts part 2. Let’s take a look at how we use these with our strategy 🔥

$spy $qqq $amd $tsla $meta $aapl $baba $nvda $iwm $nio Image
Let’s start with flags again. There my favorite, easy to see and play plus we see a lot of them.

They are giving the stock a chance to breath and reset after a strong move up or down. Wait for them to break then buy the retest at the key ema to catch the next move! ImageImageImage
Head and shoulders. I don’t really play these much as they are a form of chop on an intraday level.

Occasionally they line up with the emas for a nice play, but other than that I usually stay away. I prefer to trade a trend ImageImage
Read 9 tweets
Jun 1
A good trading strategy should allow you to be a profitable trader with a win rate of 50% minimum!

If you take 2 trades (1 winner and 1 loser) you should end the day green. Here’s an example from today, and why keeping loses small is so important!
$spy $qqq $fb $amd
This first play is $qqq
It checked all the boxes for my strategy.
We get an ema cross down ✅
Below the 200ema ✅
Retest the 13ema for safe entry✅
I entered the trade and let it work by raising my stop loss. Secured an average gain of 50% ImageImageImage
Then we get a similar setup with $fb
The emas were not in alignment for me to consider it A+ but still felt it was worth the R/R. So I entered on the 13ema pullback just as before, went green for a minute then rallied up. Cut the trade for a -15% loss Image
Read 5 tweets
May 30
Let’s take a look at what some of these common chart patterns look like on a real chart, and how we can fit them into our own trading strategies to add confidence to our trades 🤙
$spy $qqq $tsla $amd $fb $nvda
Bull and Bear flags are a favorite of mine. It’s no coincidence they usually break right at our key ema resistance/support levels. Seeing this gives me a lot of confidence that the trend is strong and buying the dip/pullback is safe
These triangle patterns can be used the same way as flags. They add confirmation to a dip/pullback buy.

They are essentially telling you that we are getting higher lows into ema support on uptrend, or lower highs into ema resistance on downtrend.
Read 9 tweets

Did Thread Reader help you today?

Support us! We are indie developers!


This site is made by just two indie developers on a laptop doing marketing, support and development! Read more about the story.

Become a Premium Member ($3/month or $30/year) and get exclusive features!

Become Premium

Don't want to be a Premium member but still want to support us?

Make a small donation by buying us coffee ($5) or help with server cost ($10)

Donate via Paypal

Or Donate anonymously using crypto!

Ethereum

0xfe58350B80634f60Fa6Dc149a72b4DFbc17D341E copy

Bitcoin

3ATGMxNzCUFzxpMCHL5sWSt4DVtS8UqXpi copy

Thank you for your support!

Follow Us on Twitter!

:(