
Here is what YOU should know about BREAKOUTS before you lose money on them !
A free FAILED BREAKOUT analysis for you - 🧵
A free FAILED BREAKOUT analysis for you - 🧵
A technical analysis term, used to show a rise in a stock’s price above its resistance level (such as its previous high price) or drop below its support level (commonly the last lowest price.)
The assumption is that the stock will continue to move in the same direction following the breakout, which generates a buy or sell signal.
Trading breakouts is an excellent trading strategy that involves buying or selling an asset after a long period of consolidation.
Trading breakouts is an excellent trading strategy that involves buying or selling an asset after a long period of consolidation.
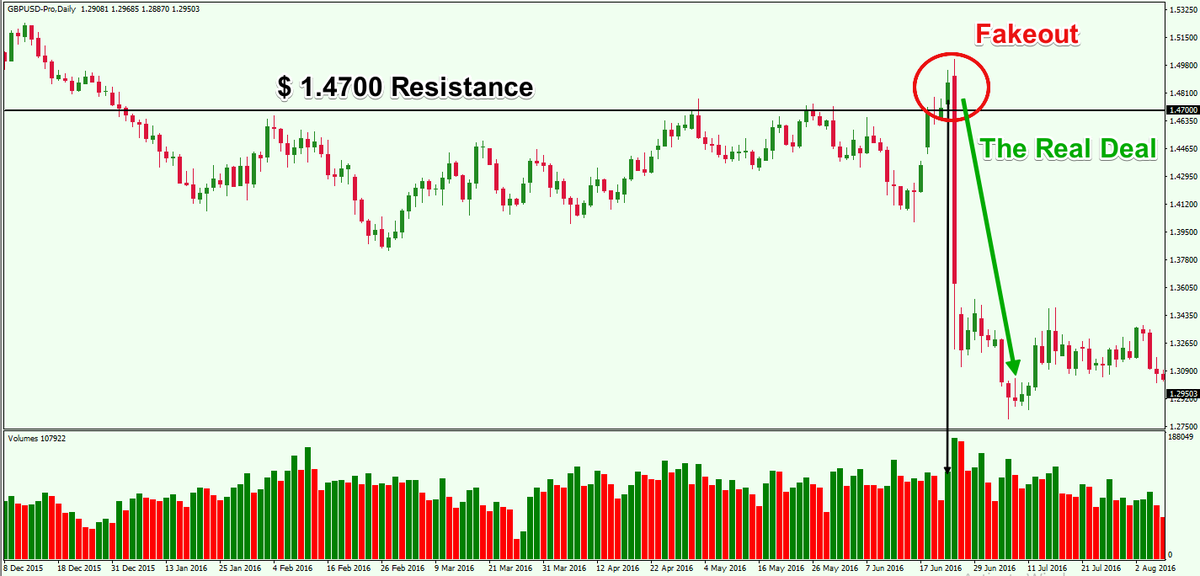
However, the biggest risk of trading a breakout is when the price suddenly reverses, in what is known as a false breakout. In this report, we will look at what a false breakout is, how you can identify it, and how you can use it in the market.
Let's look at plenty of False Breakout Examples ⚡️
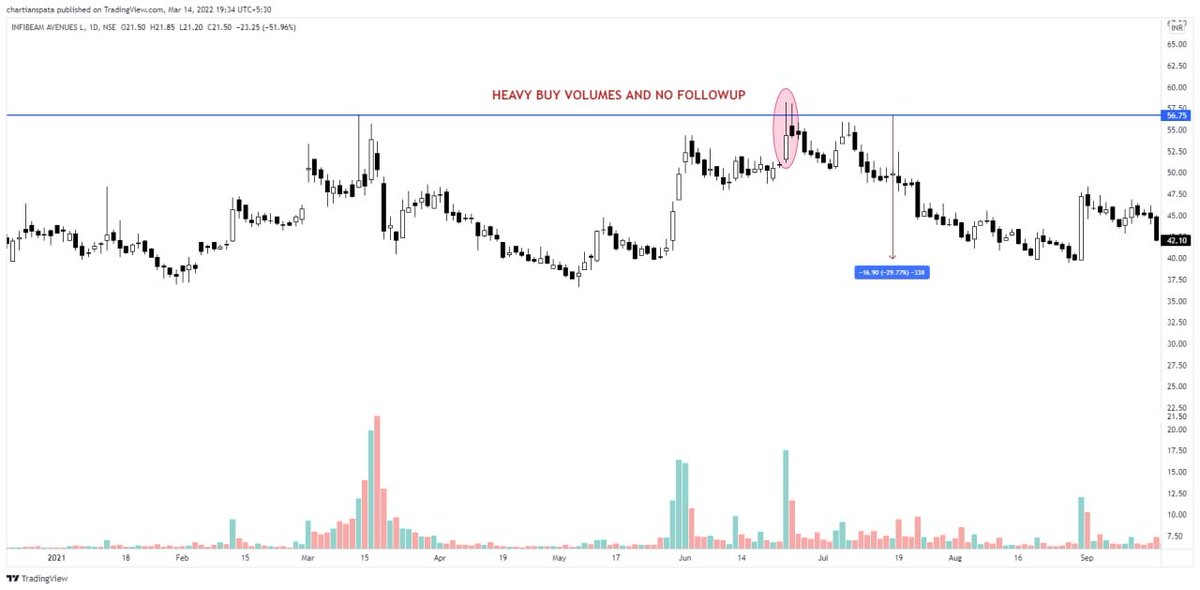
1. #INFIBEAM ⚡️
We saw a top out pattern, interesting part is the candle that gave a top was a heavy buying candle. No follow-up and stock is down nearly 30%.
1. #INFIBEAM ⚡️
We saw a top out pattern, interesting part is the candle that gave a top was a heavy buying candle. No follow-up and stock is down nearly 30%.
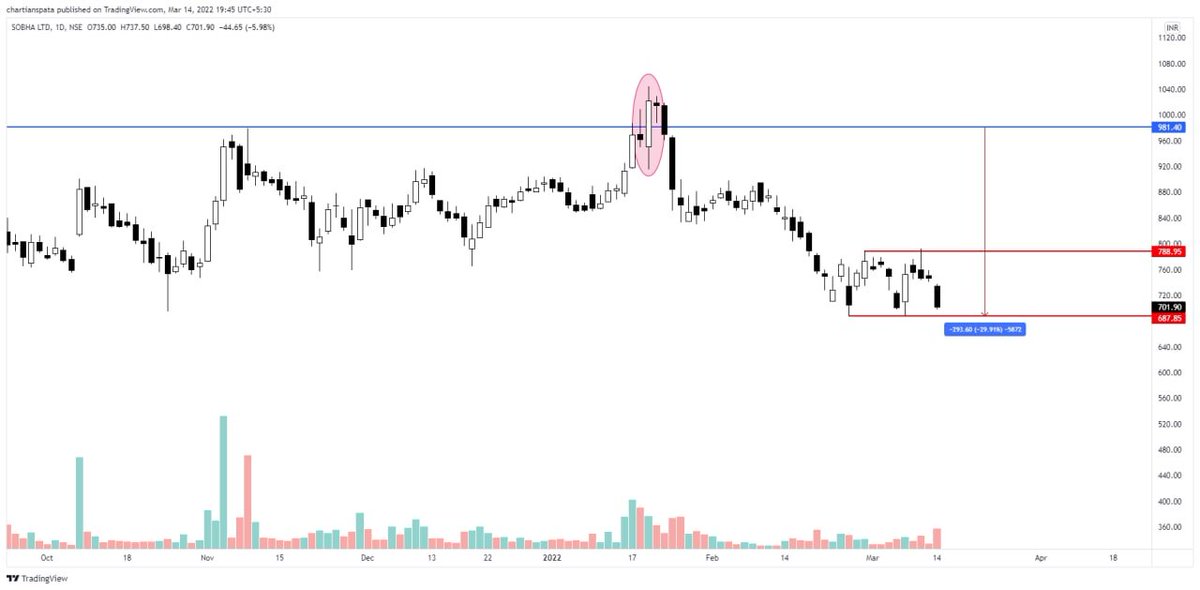
2. #SOBHA⚡️
This realty favourite stock 1st saw a DOJI that tried closing in but couldn't and the next day we say a green candle. Here the catch was to see that there was no follow up buying and stock ended up correcting nearly 30% and is still poised to crackdown more.
This realty favourite stock 1st saw a DOJI that tried closing in but couldn't and the next day we say a green candle. Here the catch was to see that there was no follow up buying and stock ended up correcting nearly 30% and is still poised to crackdown more.
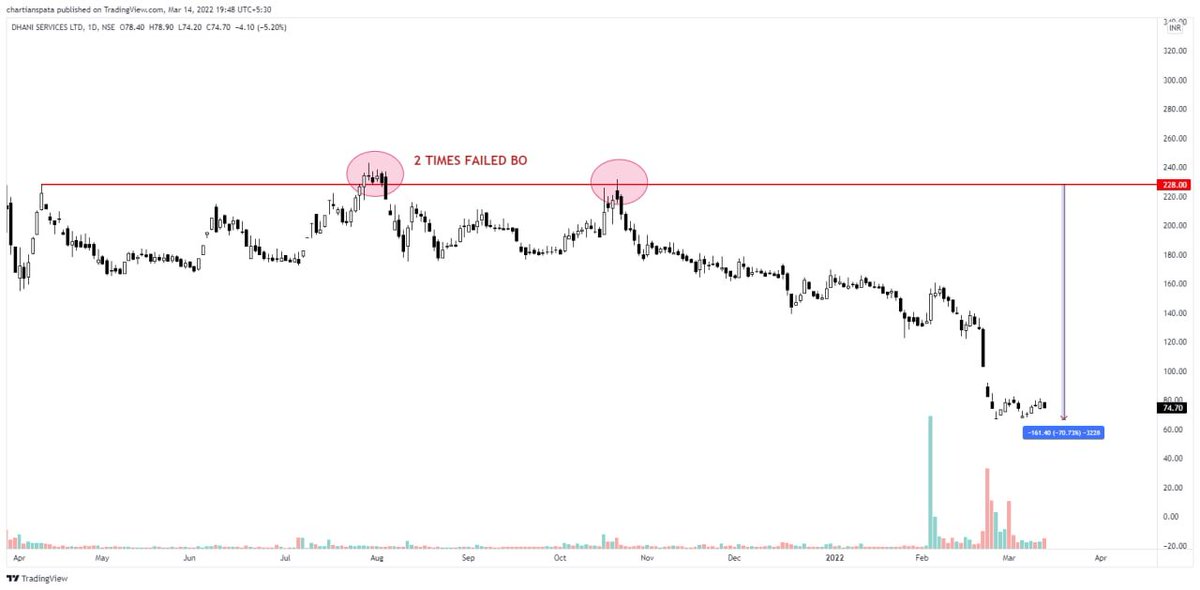
3. #DHANI⚡️
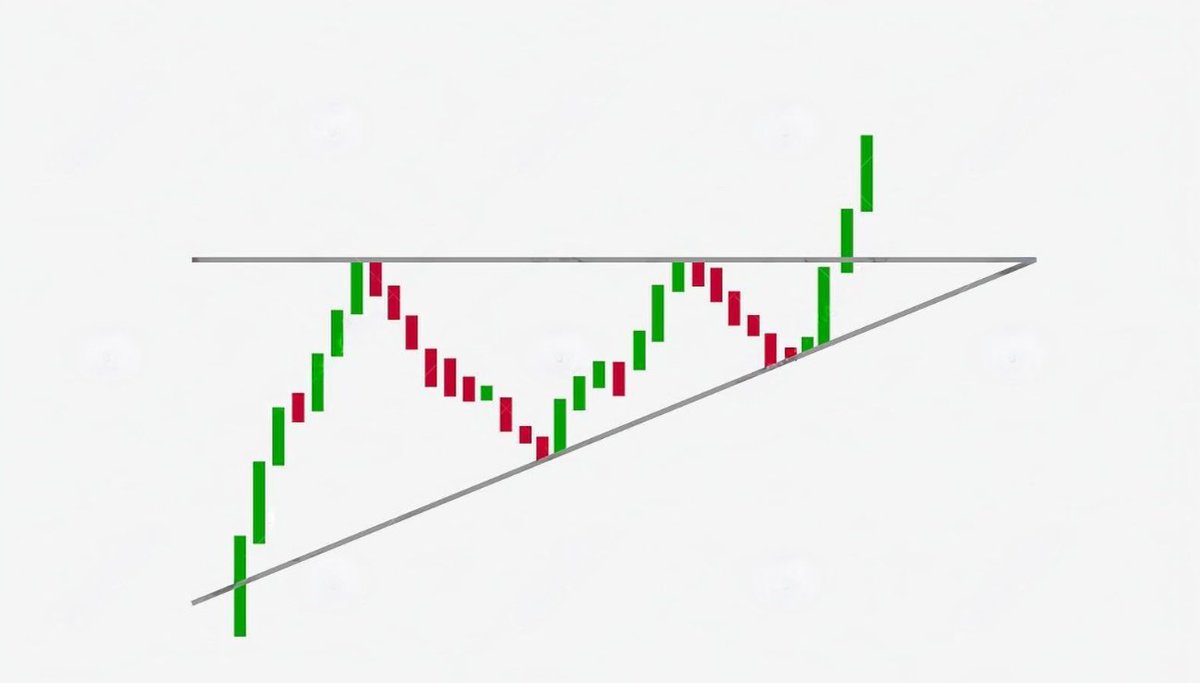
It made a triple attempt, or what we call a double top BO failure. Nothing much to explain, but it was a pure exit when the stock failed to break an 8 month breakout too. RED FLAG.
It made a triple attempt, or what we call a double top BO failure. Nothing much to explain, but it was a pure exit when the stock failed to break an 8 month breakout too. RED FLAG.
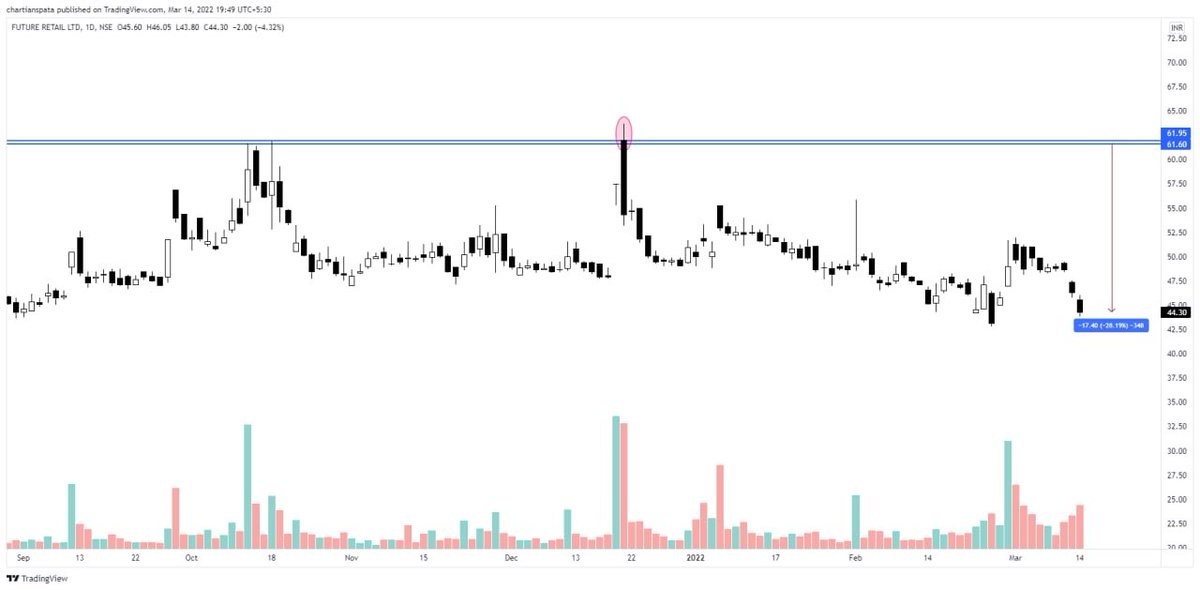
4. #FUTURERETAIL ⚡️
We don't know why retail bought this stock. But one thing to keep in mind is heavy selling + failed BO + such gullible names way below 200WMA. Don't buy. If you do. Make sure you know when to exit.
We don't know why retail bought this stock. But one thing to keep in mind is heavy selling + failed BO + such gullible names way below 200WMA. Don't buy. If you do. Make sure you know when to exit.
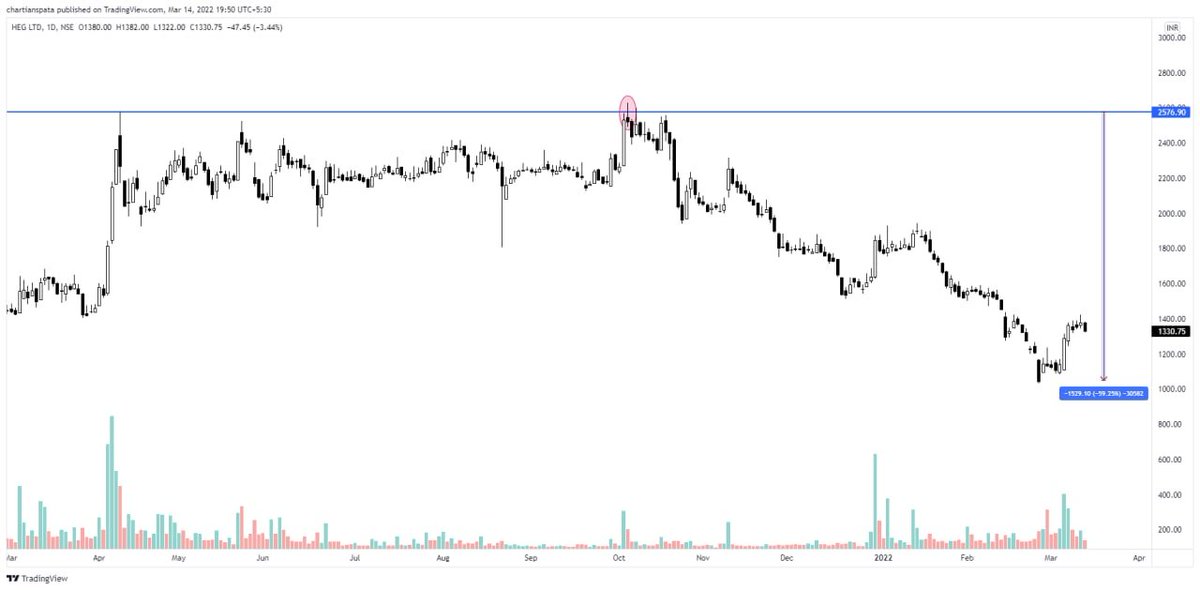
5. #HEG ⚡️
The 2018 darling stock. Another common sense exit when the stock is chased by multiple gurus and TV /TG channels.
Doji at resistance + small candles near BO. EXIT or take a 60% dent.
The 2018 darling stock. Another common sense exit when the stock is chased by multiple gurus and TV /TG channels.
Doji at resistance + small candles near BO. EXIT or take a 60% dent.
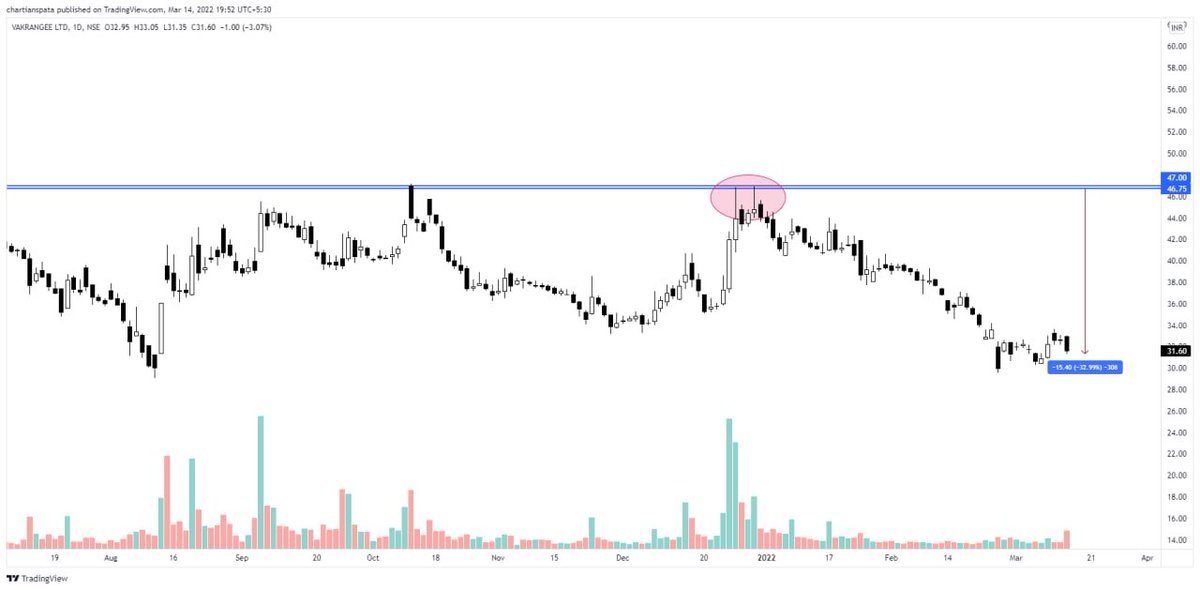
6. #VAKRANGEE ⚡️
We personally traded this and booked 19% loss. Previous O=H candle with huge buying and no followup. We too didn't know why we held on to it.
We personally traded this and booked 19% loss. Previous O=H candle with huge buying and no followup. We too didn't know why we held on to it.
Now that we have seen plenty of Examples, let's now understand as to when it happens?
⚡️WHEN DOES IT HAPPEN?
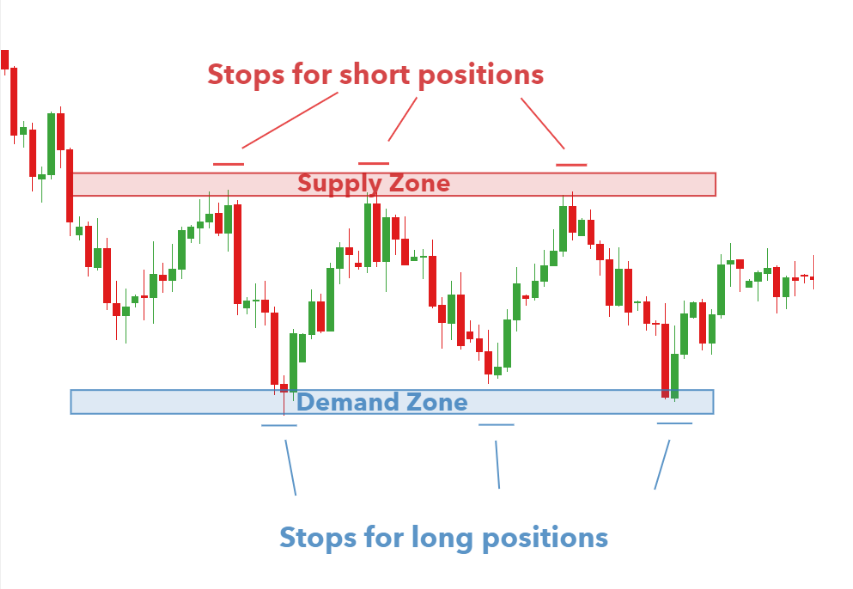
Ideally, a false breakout happens when there are not enough bulls or bears to continue supporting the asset.
⚡️WHEN DOES IT HAPPEN?
Ideally, a false breakout happens when there are not enough bulls or bears to continue supporting the asset.

In the examples above, the lower false breakouts happened when bears found strong resistance from bulls.
Similarly, the upper false breakouts happened because there were not enough bulls to continue pushing the price higher.
Similarly, the upper false breakouts happened because there were not enough bulls to continue pushing the price higher.
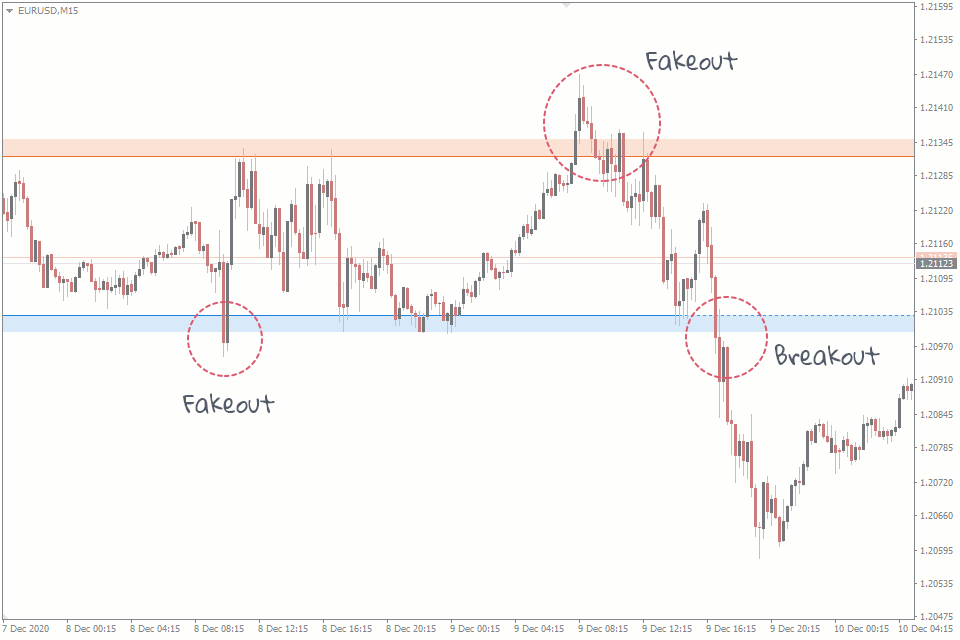
There are two primary types of a false breakout:
1. ⚡️Bull trap –This happens when the price crosses a key resistance and then pulls back after a short while.
2. ⚡️Bear trap–This happens in a bearish trend when the price moves below a key support and then returns to the channel.
1. ⚡️Bull trap –This happens when the price crosses a key resistance and then pulls back after a short while.
2. ⚡️Bear trap–This happens in a bearish trend when the price moves below a key support and then returns to the channel.
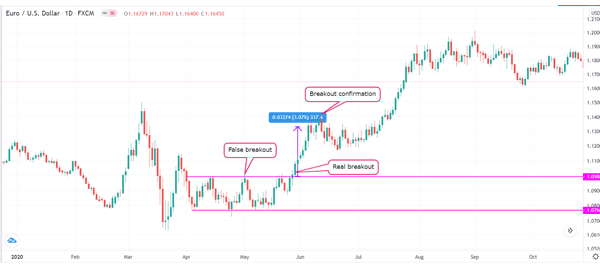
⚡️3% RULE OF BREAKOUT
This Rule will help you identify false breakouts!
First, you need to wait for a few days to confirm whether what has happened is a real breakout.
This Rule will help you identify false breakouts!
First, you need to wait for a few days to confirm whether what has happened is a real breakout.
While doing this may seem like a counterproductive thing to do, the reality is that it will see you avoid losing money through a false breakout.
To do this, traders use the 3% rule, which means that the price needs to rise above the resistance level by 3% to confirm a breakout.
To do this, traders use the 3% rule, which means that the price needs to rise above the resistance level by 3% to confirm a breakout.
⚡️How to Actually save yourself from Fake breakouts?
1⃣If the breakout isn’t 3%+ and starts giving selling pressure signals. It’s time to exit or at least trim down the positions.
1⃣If the breakout isn’t 3%+ and starts giving selling pressure signals. It’s time to exit or at least trim down the positions.
2⃣Even after huge amount of buying, the candle doesn’t close above the breakout level, then it means weak hands have entered and the smart money or big money has exchanged hands.
3⃣ Doji’s and Hammers near Resistance. Multiple days spent but still stock price not able to sustain above that level.
4⃣News based breakouts and then closing below BREAKOUT level.
4⃣News based breakouts and then closing below BREAKOUT level.
CONCLUSION
We will leave you guys with a famous quote from our mentor @kach0289
"Breakouts break YOU out first, before Breakout". ⚡️
We will leave you guys with a famous quote from our mentor @kach0289
"Breakouts break YOU out first, before Breakout". ⚡️
If you liked what you read, a like and retweet would go a long way in maximizing the reach of this tweet. Thanks <3
Join Us | telegram.me/chartians
We post charts with logic and trade them!
RIGIPAY - rigipay.com/g/YfU1pfvEOS
Join Us | telegram.me/chartians
We post charts with logic and trade them!
RIGIPAY - rigipay.com/g/YfU1pfvEOS
• • •
Missing some Tweet in this thread? You can try to
force a refresh


