Nahel Belgherze Profile picture
Jun 25, 2022 10 tweets 7 min read Read on X
La semaine prochaine, @meteofrance basculera officiellement vers les normales (références climatiques) 1991-2020, remplaçant ainsi les normales 1981-2010. Dans un contexte de changement climatique, à l'allure où vont les choses, ces normales sont-elles déjà dépassées ? #Thread
📖 Lecture indispensable avant de commencer à en discuter (focus température dans ce thread): meteofrance.com/actualites-et-… cc @meteofrance @cassouman40 @BonPote
Cette transition vers les nouvelles réf. climatiques calculées sur la période 1991-2020 est un vrai casse-tête en termes de communication. Ces nouvelles normales seront représentatives d’un #climat centré sur les années autour de 2005 (un climat qui n’existe déjà plus?!) #Biais
Ces "normales" servent à représenter le climat d'une période donnée, elles sont calculées sur 30 ans (règles de l’Organisation météorologique mondiale) mais cette convention est en train d'être légitimement remis en question (même par des climatologues) en climat « transitoire ».
Un risque -> minimisation du RC… Le "gap" entre les 2 normales sur 30 ans (1981-2010 vs 1991-2020) est « important ». Évolution sensible 📈 notamment pour les différents indicateurs liés aux températures. « Baisse » logique des valeurs d’anomalies de T°+ (chaude) /normales. Ex:
Cette comparaison est assez parlante pour mettre en évidence ce « gap » (@CopernicusECMWF). Je suis certain que vous comprendrez ce qui est en jeu ici et pourquoi la pédagogie/communication sera cruciale. Sceptiques et autres dénialistes sont à l’affut…
« Depuis 1900, la T°moy en France s’est réchauffée de 1,7°C. Chaque décennie depuis 1970 est plus chaude que la précédente. Ces dix dernières années, la période 2011-2020, la 📈 atteint +0,6 °C et marque la plus forte progression observée entre 2 décennies en 🇫🇷 depuis 1900. »
📊Autre manière interessante de visualiser l’évolution des normales climatiques avec une déclinaison pour chaque saison. Le constat est sans appel. Toujours plus chaud. Données @meteofrance (retravaillé). Nouvelle normale de T° calculée (1991-2020): 12,97 °C, +0,42 °C /1981-2010.
Je pourrais poursuivre mais je pense avoir dit l’essentiel (pensez à lire l’article MF en haut). @meteofrance et d’autres (pro) reviendront à coup sûr sur le sujet dans les prochains jours. Je l’espère en tout cas. Je pense à @cassouman40 @GaetanHeymes etc. notamment.
Rappel: Le calcul des normales concerne toutes les variables du climat (température, précipitation, vent, ensoleillement…). J’aime bien cette phrase de dann17 (via les forums @infoclimat) alors je termine ce #Thread sur ces quelques mots. Bye!

• • •

Missing some Tweet in this thread? You can try to force a refresh
 

Keep Current with Nahel Belgherze

Nahel Belgherze Profile picture

Stay in touch and get notified when new unrolls are available from this author!

Read all threads

This Thread may be Removed Anytime!

PDF

Twitter may remove this content at anytime! Save it as PDF for later use!

Try unrolling a thread yourself!

how to unroll video
  1. Follow @ThreadReaderApp to mention us!

  2. From a Twitter thread mention us with a keyword "unroll"
@threadreaderapp unroll

Practice here first or read more on our help page!

More from @WxNB_

Dec 17, 2024
High-resolution satellite imagery of the French territory of Mayotte after Cyclone Chido is now available and I'm out of words to describe the devastation. Hundreds are feared dead.

A thread. Image
Image
Mtsapéré, Mayotte. Image
Image
Bandrajou, Mayotte Image
Image
Read 4 tweets
May 10, 2024
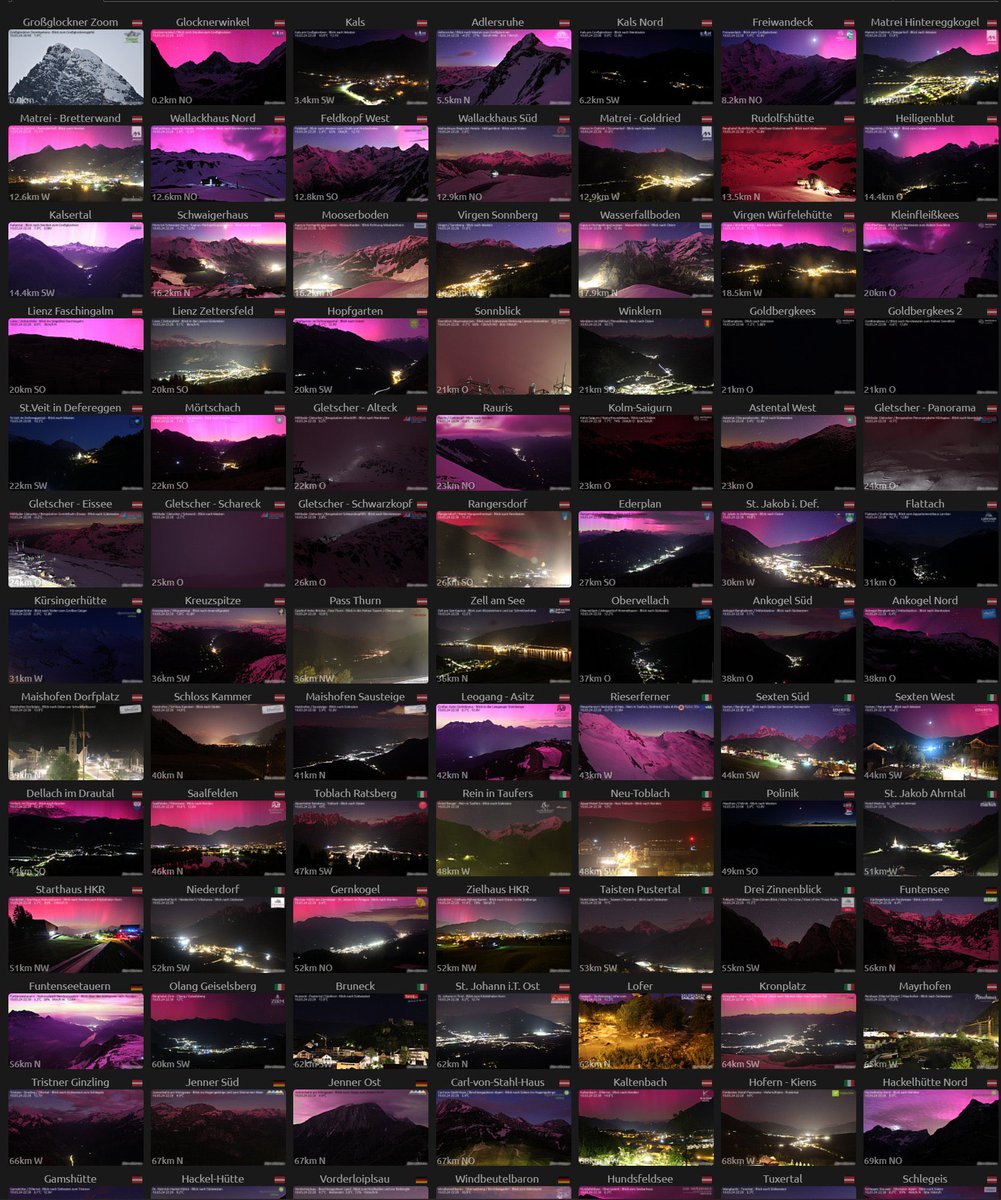
BREAKING: Thousands of reports of Northern Lights coming in from multiple locations across Europe. A severe G4 geomagnetic storm is currently affecting Earth. Truly the most stunning aurora show in years. Currently visible as far south as northern Italy. Image
Read 10 tweets
Jan 29, 2024
New data collected by the Geospatial Information Authority of Japan reveals that approx. 90 km of the northern Noto Peninsula coastline has shifted offshore, exposing around 4 sq. km. of previously submerged land, following the Jan. 1st M7.6 earthquake.

A short thread.
In other words, Japan has actually gained approximately 4 km² of land area due to this earthquake. For perspective, Central Park in NYC is 3.41 km². On a national scale it's insignificant, but on the scale of a prefecture, it's obviously much more noticeable. Image
According to the official ranking of Japan’s 47 prefectures based on their surface area in km², Ishikawa, which features the most of the Noto Peninsula, is separated from Fukui by only 4.4 km². Coincidentally, this is exactly the area that Ishikawa gained from the sea.

Image
Source: https://www.gsi.go.jp/common/000153121.pdf
Read 8 tweets
Jul 22, 2023
The Mediterranean Sea is heading into uncharted territory. The recent powerful “heat dome” over southern Europe has led to an extremely rapid warming of the waters in the western part of the bassin, with SSTs now exceeding 30°C off the coast of southern Italy.

A short thread. Image
In case you didn’t know, sea surface temperatures usually peaks in late August in the Mediterranean Sea. As you can see from the graphic below, the Med. bassin has never been this warm so early in the year and is likely to break its all-time high in the next few days. Image
As you might expect, SSTs have warmed incredibly fast in the last few days. The recent extreme temperatures in the area has triggered a significant marine heatwave which is now spreading eastwards. Almost the entire Mediterranean basin will be affected.

This is critical.
Read 7 tweets
Feb 9, 2023
Newly available Maxar satellite imagery shows several hundred meters long surface rupture with horizontal displacements up to 4m near Nurdağı, Gaziantep province, Turkey.
Here's a zoomed out version. Gaziantep Province is fractured, literally. I will certainly post more images in the next few days. Let's pray for Turkey...
Read 5 tweets
Jan 13, 2023
This Sunday, January 15, will mark one year since the eruption of the Hunga Tonga–Hunga Haʻapai volcano shocked the world. I remember being awestruck by these images.

A short thread.
In the Volcanic Explosivity Index scale, the eruption was rated at least a VEI-5. It was the most powerful eruption since the 1883 eruption of Krakatoa with an estimated eq. TNT yield of 100-200 megatons, more than the Tsar Bomba, the most powerful nuclear weapon ever detonated.
Tonga volcano had the highest plume ever recorded. The column of ash reached almost 58km altitude (36 miles). After one hour, the cloud of volcanic ash was roughly 650km wide. For comparison, that's roughly size of mainland Spain. earthobservatory.nasa.gov/images/149474/…
Read 10 tweets

Did Thread Reader help you today?

Support us! We are indie developers!


This site is made by just two indie developers on a laptop doing marketing, support and development! Read more about the story.

Become a Premium Member ($3/month or $30/year) and get exclusive features!

Become Premium

Don't want to be a Premium member but still want to support us?

Make a small donation by buying us coffee ($5) or help with server cost ($10)

Donate via Paypal

Or Donate anonymously using crypto!

Ethereum

0xfe58350B80634f60Fa6Dc149a72b4DFbc17D341E copy

Bitcoin

3ATGMxNzCUFzxpMCHL5sWSt4DVtS8UqXpi copy

Thank you for your support!

Follow Us!

:(