Scott Irwin Profile picture
Jun 28 9 tweets 4 min read
1. With the June Acreage report up on Thursday, good time to review what we know about revisions to USDA planted acreage estimates. My latest #FDD article.
2. Important first finding. Revisions to USDA March Prospective Plantings estimates are unbiased for major crops and total principal crops. Average revisions from March-January very, very close to zero. In other words, statistically unbiased. Image
3. Unbiased does not mean unchanging. Not unusual for corn planted acreage revisions to be up or down as much as 2 million acres. That matters to the market. Key is that ups and downs tend to offset over time. Image
4. Here is the weirdest finding. One of the bigger puzzles I know about for any USDA estimate. March acreage estimates should NOT be unbiased after considering prevented plant acres, but they are. In other words, Mar - Jan = PP (on average). But this is not the way it works. Image
5. All else constant, if PP is 4 million acres, then final Jan estimate for corn should be less than Mar by 4 million. Historically, Jan only falls by 1.2 million acres. What gives? Its as if farmers include some PP in March acreage intentions but don't tell the USDA. Image
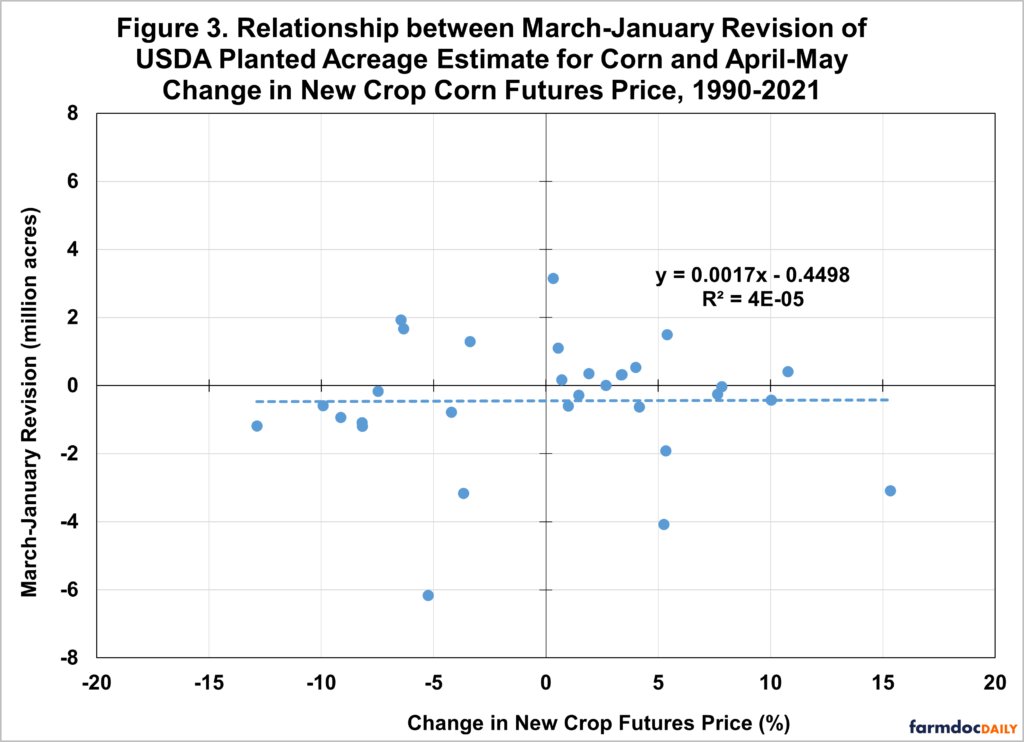
6. Always talk every year about the market buying this or that crop acres after the March Prospective plantings report. I have tried many price variables and I cannot find any useful relationships that match the market chatter. Image
7. Its possible that price relationships are more subtle than I what I tested. Still have to conclude it is very hard to predict USDA planted acreage revisions based on market data. Image
8. Last but not least, Mar-Jun acreage revision dominates later revisions to estimates. Roughly 80-90% of total Mar-Jan revision explained by Mar-Jun revision. Implication: June Acreage report is the big show in terms of revisions to USDA planted acreage estimates. Image
9. So, what will it be this Thursday? My research says the only responsible answer is I don't know the direction or magnitude of revisions coming up, but I do know they will likely be market moving. Buckle up. farmdocdaily.illinois.edu/2022/06/what-d…

• • •

Missing some Tweet in this thread? You can try to force a refresh
 

Keep Current with Scott Irwin

Scott Irwin Profile picture

Stay in touch and get notified when new unrolls are available from this author!

Read all threads

This Thread may be Removed Anytime!

PDF

Twitter may remove this content at anytime! Save it as PDF for later use!

Try unrolling a thread yourself!

how to unroll video
  1. Follow @ThreadReaderApp to mention us!

  2. From a Twitter thread mention us with a keyword "unroll"
@threadreaderapp unroll

Practice here first or read more on our help page!

More from @ScottIrwinUI

Jun 29
1. Weekly gasoline use number from EIA this morning. Provides a valuable perspective on the impact of $5 gas at the pump. Notice that last year at this time gasoline use finally recovered to the pre-pandemic 2019 level and stayed there for rest of year. (red vs. yellow lines) Image
2. Now looks at 2022 (purple) vs. 2019 (yellow). Started out strong in 2022, with gasoline usage largely tracking 2019 pre-pandemic level until late February. Then you know what happened on Feb 24 courtesy of comrade Putin. Image
3. Since the spike in crude oil and gasoline prices post-Ukraine war, US gasoline use has fallen behind both 2019 and 2021 levels. Struggling to reach 9 million barrels per day. Image
Read 6 tweets
May 27
1. If this is accurate, Ukrainian farmers have managed to plant 78% of last years acreage this year. What a heroic accomplishment in the midst of war. This also means that Ukraine's ag production in 2022 will not be down nearly as much as many feared, if weather is decent.
2. This also confirms my firm belief in the dedication of farmers around the world to plant their crops if there is any way humanly possible to get it done. This impulse is to be greatly admired. Farmers gonna plant. That simple.
3. I wrote in my Time article on April 14th: "I think it is now safe to assume that at least half of Ukraine’s spring crops will be planted, and I will not be surprised if two-thirds or more is planted." Looks like I was too conservative. time.com/6166810/ukrain…
Read 6 tweets
May 27
1. I guess the USDA decided they finally needed to do something @TheStalwart. I won't say a day late and a dollar short but that phrase does come to mind :). This is actually a sensible thing to do but at the margin will have little impact. I will explain.
@TheStalwart 2. First off this "release" only applies to acres that farmers had already decided would be coming out of the CRP. It will not affect the other 18-20 million acres in the CRP program.
@TheStalwart 3. Any expiring CRP acres were under contract with the USDA through Oct 1. If farmers touched those acres before Oct 1 they could be heavily fined. This one year exception from the USDA will waive the penalty and let fieldwork begin after nesting season for birds affected.
Read 6 tweets
May 26
1. Want to summarize what my analysis shows about late planting impacts this year for US average corn and soybean yields. Start with corn. Cutoff is May 20th so know that number for 2022. Late planting interpolated from weekly progress is 34.6%. Implies 3.5bpa below trend.
2. If we start with USDA Feb number of 181 and subtract 3.5 bushels we get 177.5. Only half a bushel more than USDA's 4 bushel adjustment in the May WASDE report.
3. Cutoff for soybeans for late planting in my model is May 25. I am guessing 60% planting progress through yesterday, for 40% late planting. Slightly above average, and therefore, no measurable impact on trend yield projection.
Read 5 tweets
May 26
1. Told you I was obsessed with late planting and grain yields. Promise this is my last one this year. Really. Had to cover soybeans to be complete. Overall similar results to corn from my earlier articles this spring.
2. Here is my measure of late planting in soybeans. Late planting is defined for as the percentage of the U.S. soybean crop planted after June 5th from 1980-1985, May 30th from 1986-1999, and May 25th from 2000 forward. Average higher than corn do to double cropping.
3. Late planting measure vs. trend yield deviations from US average soybean yield. The results indicate a 10 percent increase in late planting decreases the U.S. average soybean yield by about 0.5 bushels per acre.
Read 6 tweets
May 25
1. I am not blaming @ArlanFF101 here. He is just the messenger. But the stupidity of the trade on ethanol blending just astounds me. RFS ethanol waivers will not destroy physical ethanol demand. Let me repeat. RFS ethanol waivers will not destroy physical ethanol demand.
@ArlanFF101 2. We have already been down this road with the SREs for the RFS. Billions of gallons of RFS waivers in the form of SREs in 2017-2019. RIN prices crashed. Impact on physical ethanol blending. NADA. I have written volumes on this (pun intended) farmdocdaily.illinois.edu/category/autho…
@ArlanFF101 3. Theoretically there is the possibility of E15 demand being lost due to mandate waivers. But that is so small it is hard to detect in aggregate data. Maybe a few hundred million gallons of ethanol in total. In addition, E15 use actually GREW during the period of SREs.
Read 7 tweets

Did Thread Reader help you today?

Support us! We are indie developers!


This site is made by just two indie developers on a laptop doing marketing, support and development! Read more about the story.

Become a Premium Member ($3/month or $30/year) and get exclusive features!

Become Premium

Don't want to be a Premium member but still want to support us?

Make a small donation by buying us coffee ($5) or help with server cost ($10)

Donate via Paypal

Or Donate anonymously using crypto!

Ethereum

0xfe58350B80634f60Fa6Dc149a72b4DFbc17D341E copy

Bitcoin

3ATGMxNzCUFzxpMCHL5sWSt4DVtS8UqXpi copy

Thank you for your support!

Follow Us on Twitter!

:(