PERSONAL INCOME & SPENDING DEEP DIVE

1/ Income and spending are two sides of the same coin, with one person’s spending powering another person’s income.This relationship isn’t necessarily 1:1, as consumers can save income. Nonetheless, the pass-through is large:
2/ Currently, aggregate income remains supported by a high level of nominal wages and heightened employment. We see this in today’s economic data, where nominal personal income grew primarily as a function of increasing employee compensation:
3/ Employee compensation accounted for 51% of monthly income growth, which remains in line with its one-year trend. On an annual basis, employee compensation continues to power nominal income growth, and the drop-off in government benefits continues to drag on growth:
4/ However, these marginal increases in income were not allocated to spending but rather saved. We show the composition of the monthly change in income and its uses:
5/ In May, 51% of income increases were saved by consumers, effectively canceling out the growth in employee compensation. The impact of these increased savings was a decline in monthly outlays, i.e., a drag on personal spending, with 60% of sub-categories turning lower in May.
6/ Over the last year, Real Consumption has been in a downtrend though the latest print breaks this trend. This sequential acceleration was due to the drop-off of last May’s data, which showed a decline of -0.5%. We offer the monthly trend:
7/ This print disappointed expectations with a monthly change of -0.4% versus expectations of -0.3%. Motor Vehicles & Parts has been the most significant driver of these moves with a weighted year-over-year growth of -8.3%.
8/These weak areas of the economy tend to be highly responsive to the business cycle, i.e., they swing ahead of major inflections in the business cycle. They bode I’ll for the business cycle. We use these components to get a sense of the direction of GDP growth to come:
9/ You could have insights like these delivered to your inbox regularly, along with actionable signals and portfolios coming from a systematic, rule-based process-
All for free. Why wouldn’t you #subscribe?

prometheusresearch.substack.com

• • •

Missing some Tweet in this thread? You can try to force a refresh
 

Keep Current with Prometheus Research

Prometheus Research Profile picture

Stay in touch and get notified when new unrolls are available from this author!

Read all threads

This Thread may be Removed Anytime!

PDF

Twitter may remove this content at anytime! Save it as PDF for later use!

Try unrolling a thread yourself!

how to unroll video
  1. Follow @ThreadReaderApp to mention us!

  2. From a Twitter thread mention us with a keyword "unroll"
@threadreaderapp unroll

Practice here first or read more on our help page!

More from @prometheusmacro

Jun 29
RECESSION INCOMING?

1/3 It is highly likely we are headed towards a recession. Arguably, we are already in one. Our economic data tracking places us at approximately 0.7% Real GDP growth versus a year ago. PCE data will confirm or deny whether we are currently in a recession:
2/3 The US economy is prototypically consumer-dominated, with 69% of GDP coming from consumer spending alone. Currently the consumer remains well supported by nominal wages + employment, as shown below. However, as cyclical components of the economy slow, these are like to drag:
3/3 During late-cycle, with interest rates rising to keep up with inflation, household spending on items that require borrowing (autos & housing mainly) tends to weaken significantly as prospects for the economy begin to decline. We aggregate these components to forecast GDP:
Read 5 tweets
Jun 28
Inflation will decline, but #Stocks will remain under pressure. A short thread:

1/6 Inflation is a function of total spending relative to the output level. We are seeing a high level of nominal expenditure, after a large fiscal impulse driving wages + employment: Image
2/6 Spending in excess of production constraints creates inflationary pressures and can only be reconciled through higher or lower expenditures. We show our gauge of excess spending relative to production alongside CPI inflation below: Image
3/6 There are only two ways this dynamic changes: reduced private sector demand (lower consumption, orders, etc.) or much higher production levels. Production of goods is much like employment in that physical constraints limit it, and therefore there are limits to the increase.
Read 6 tweets
May 31
1/6 A thread from The Observatory.

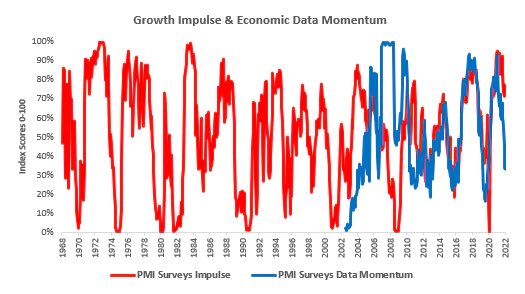
Regional surveys of economic activity continue to tell us we are in a slowdown. This data is in line with the broad trend in PMIs, which has been decelerating and disappointing expectations, and we show our measures for these below:
2/6 Today, the Dallas Fed Manufacturing Survey came in significantly lower than expected, with a reading of -7 versus the expected value of 1.5. The average of the regional surveys is now at zero, suggesting that we are at a tipping point for economic growth data.
3/6 Today, market pricing suggested weakening economic growth, with both commodities and equities down. Stagflationary nominal growth remains the dominant trend in markets; allocate accordingly. We show our market regime monitor below:
Read 6 tweets

Did Thread Reader help you today?

Support us! We are indie developers!


This site is made by just two indie developers on a laptop doing marketing, support and development! Read more about the story.

Become a Premium Member ($3/month or $30/year) and get exclusive features!

Become Premium

Don't want to be a Premium member but still want to support us?

Make a small donation by buying us coffee ($5) or help with server cost ($10)

Donate via Paypal

Or Donate anonymously using crypto!

Ethereum

0xfe58350B80634f60Fa6Dc149a72b4DFbc17D341E copy

Bitcoin

3ATGMxNzCUFzxpMCHL5sWSt4DVtS8UqXpi copy

Thank you for your support!

Follow Us on Twitter!

:(