3 Ways to Sell a Stock
1. Supertrend
2. Moving Averages
3. Relative Strength
A Thread🧵 With Live Examples
Retweet Comment and Share :)
1. Supertrend
2. Moving Averages
3. Relative Strength
A Thread🧵 With Live Examples
Retweet Comment and Share :)
SuperTrend :
It is TrendFollowing Indicator That generates Buy / Sell signals based on the ATR value or volatility of the stock
Supertrend also works as a trailing stop-loss for the existing trades Best on daily time frame
2/n
It is TrendFollowing Indicator That generates Buy / Sell signals based on the ATR value or volatility of the stock
Supertrend also works as a trailing stop-loss for the existing trades Best on daily time frame
2/n
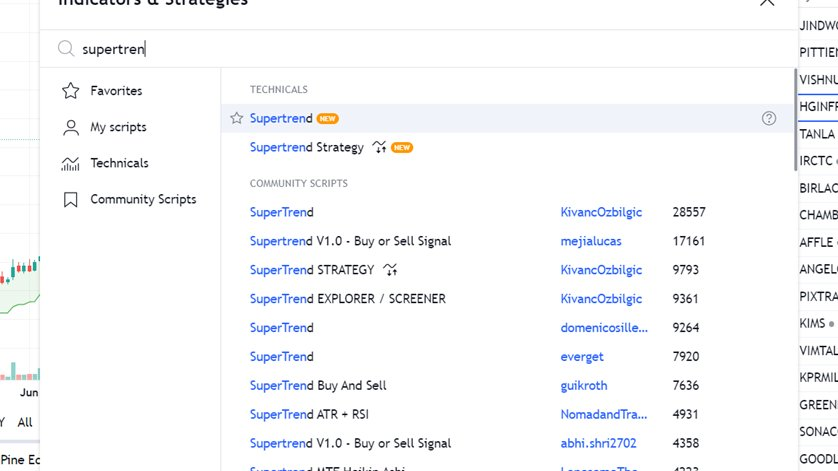

Supertrend Conditions
Works Best on 10 , 3 settings
One can try and backtest on 10 ,2 at own also !
Doesnt Work well in Sideways Zone as it is trend following indicator
3/n
Works Best on 10 , 3 settings
One can try and backtest on 10 ,2 at own also !
Doesnt Work well in Sideways Zone as it is trend following indicator
3/n

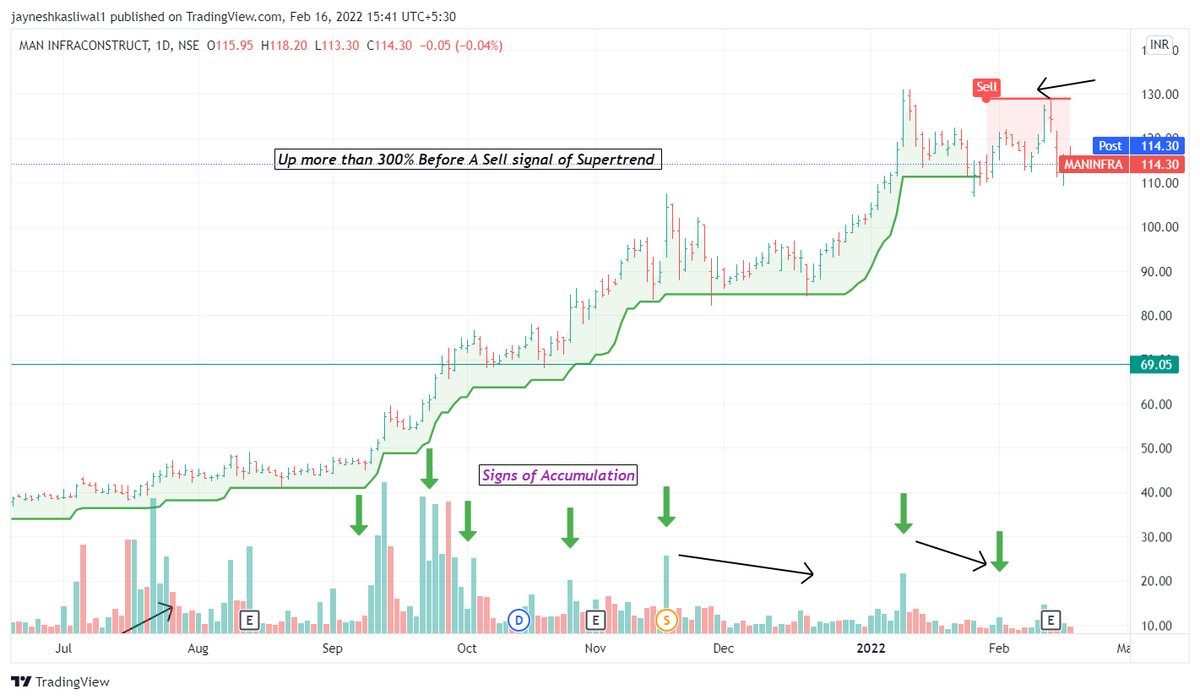
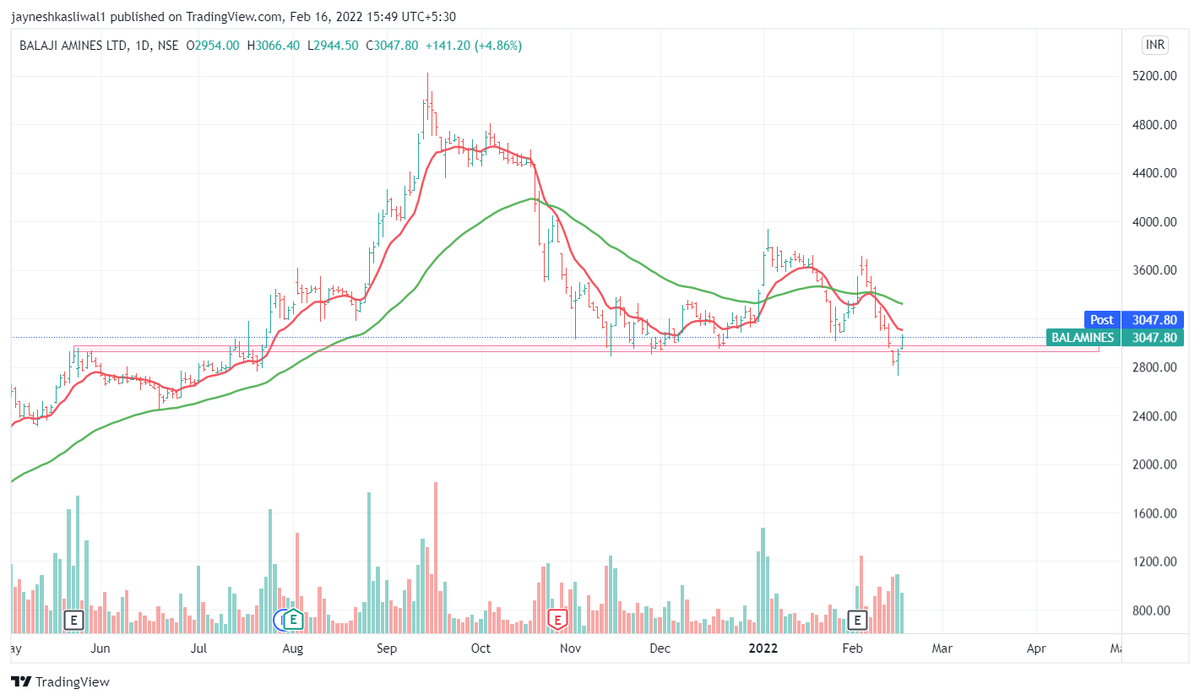
1. Works Best In trending Markets
2. Keep Riding the trend till Supertrend Turns Red
3. Use Price Action to Enter and Supertrend As Trailing Stoploss
4. Sometimes Gives Multiple Signals Where you can take Small Stoploss .
Example :
4/n
2. Keep Riding the trend till Supertrend Turns Red
3. Use Price Action to Enter and Supertrend As Trailing Stoploss
4. Sometimes Gives Multiple Signals Where you can take Small Stoploss .
Example :
4/n
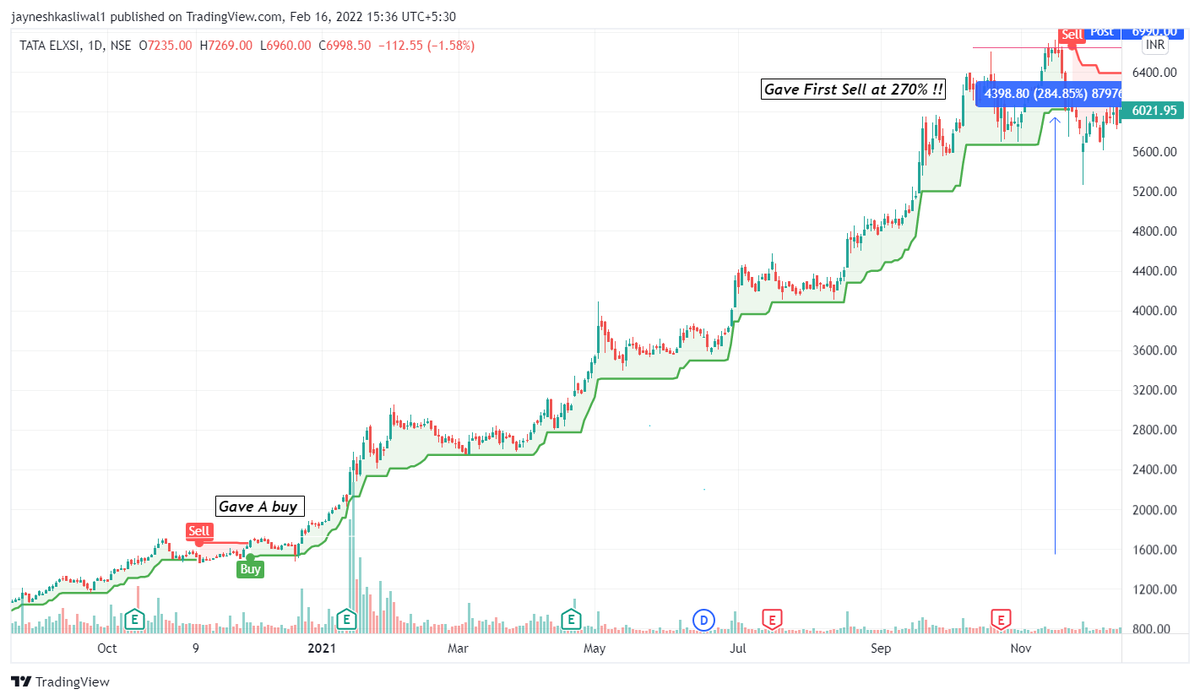
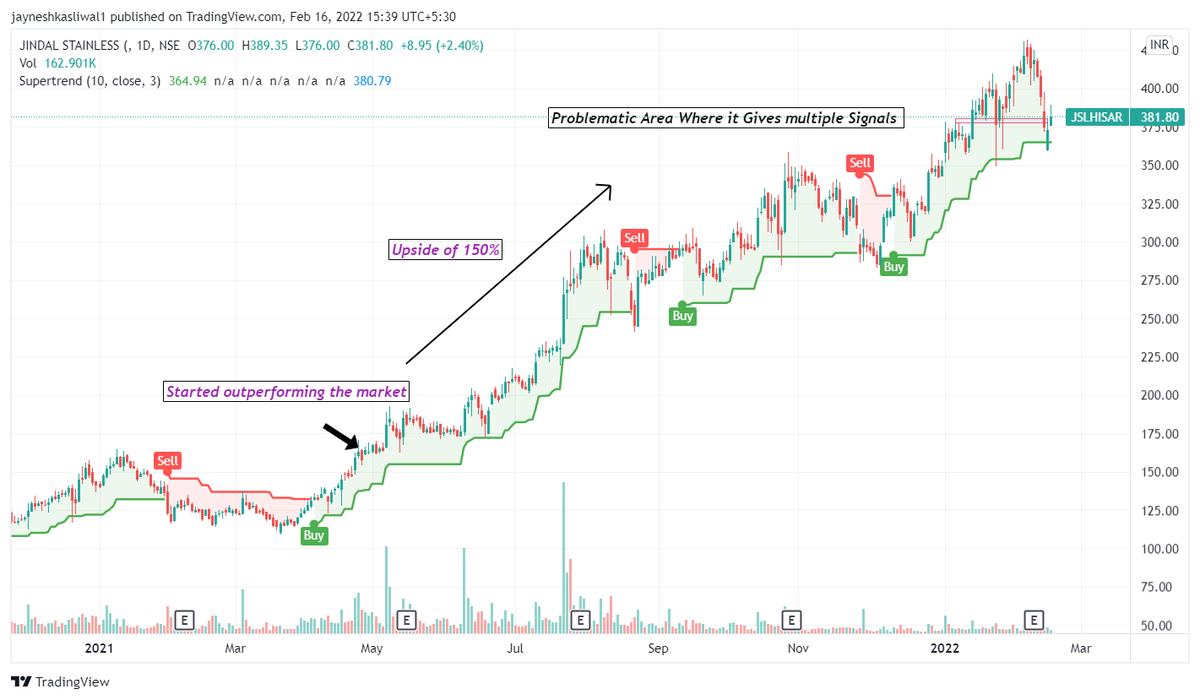
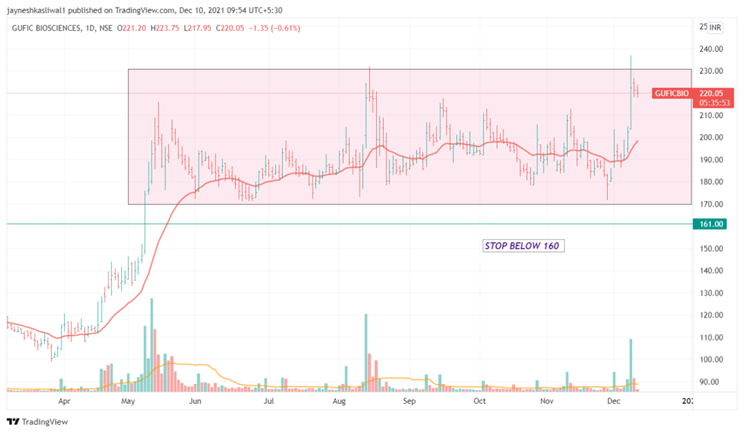
Supertrend to be avoided in Sideways markets as it gives a lot of false Signals .
Use Normal Support Resistance as Stoploss in this case
Use Supertrend in Range breakout or range breakdown whenever stock gets stuck in range
5/n
Use Normal Support Resistance as Stoploss in this case
Use Supertrend in Range breakout or range breakdown whenever stock gets stuck in range
5/n
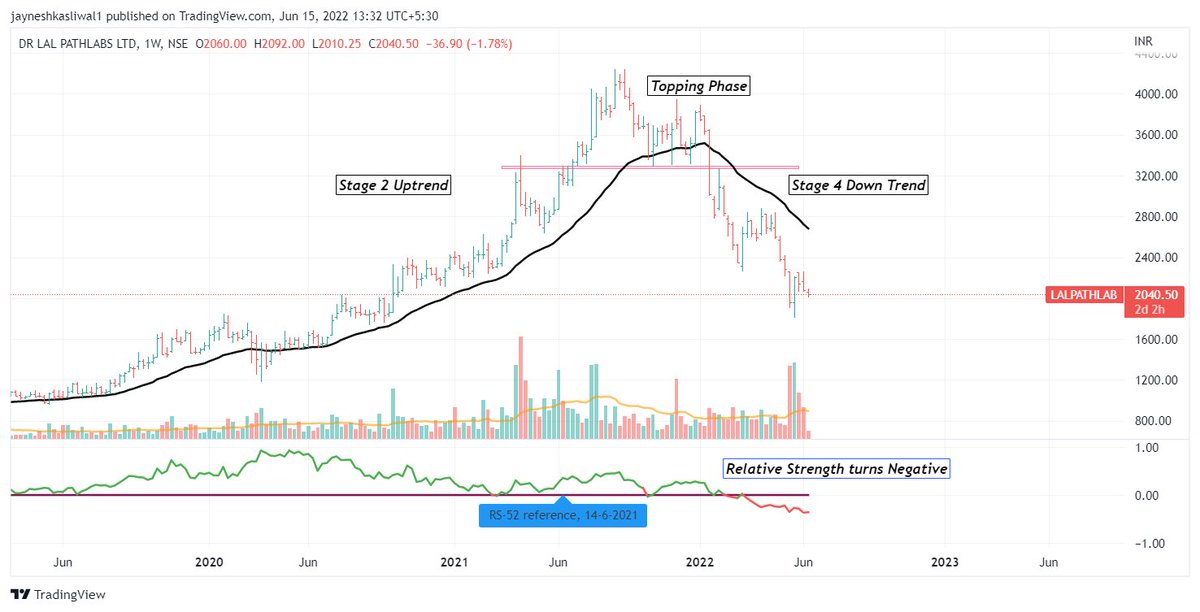
3. Moving average stoploss
The “well known” moving averages, such as the 30 , 50, 100, 200 daily moving averages act as natural support and resistance.
21 ema Momentum Trades
50 ema short term trades
200 ema positional trades
30 Weekly ema Long term trades
6/n
The “well known” moving averages, such as the 30 , 50, 100, 200 daily moving averages act as natural support and resistance.
21 ema Momentum Trades
50 ema short term trades
200 ema positional trades
30 Weekly ema Long term trades
6/n
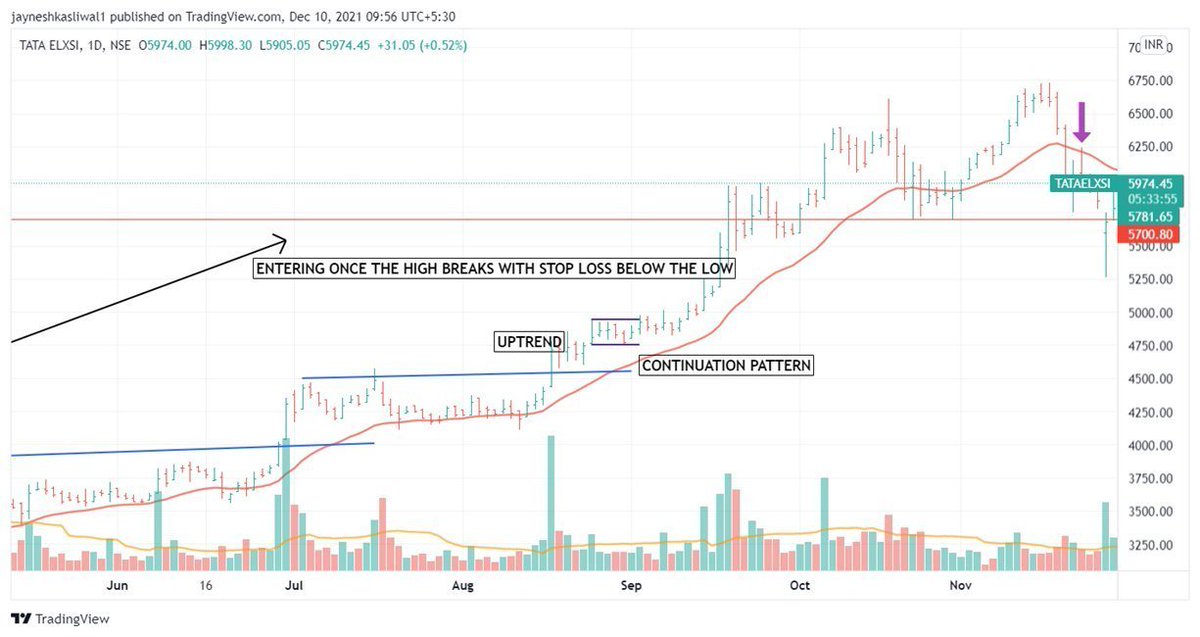
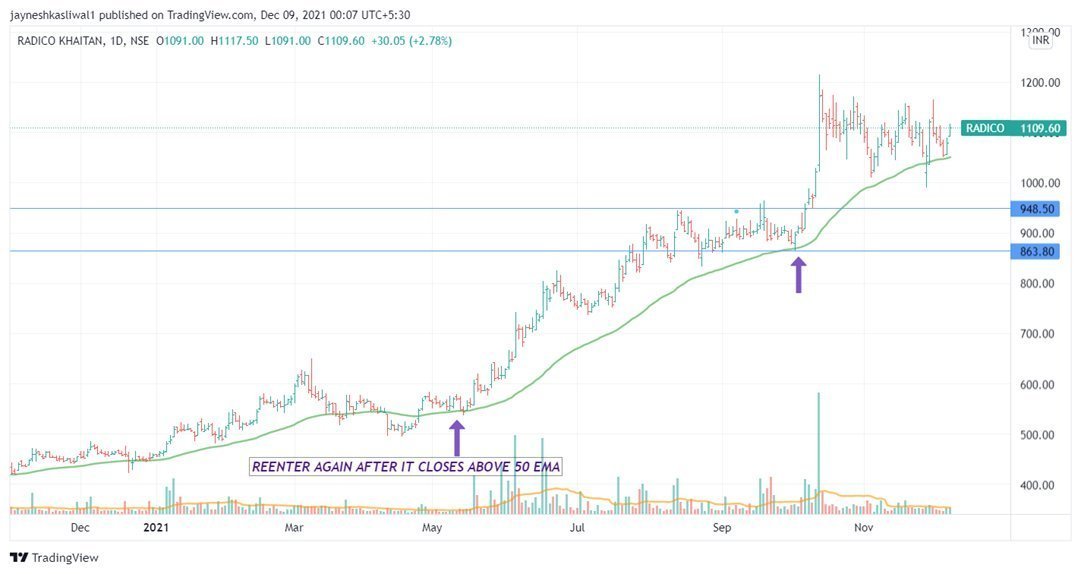
Shouldn’t be used in sidways stocks , either it should be clear uptrend or clear downtrend
Stock Will Give multiple Signals which has to be ignored
Red 21 ema
Green 50 ema
7/n
Stock Will Give multiple Signals which has to be ignored
Red 21 ema
Green 50 ema
7/n

What is Relative Strength ?
📌Relative strength is a strategy used in momentum investing and in identifying value stocks.
📌It focuses on investing in stocks or other investments that have performed well relative to the market as a whole or to a relevant benchmark
8/n
📌Relative strength is a strategy used in momentum investing and in identifying value stocks.
📌It focuses on investing in stocks or other investments that have performed well relative to the market as a whole or to a relevant benchmark
8/n
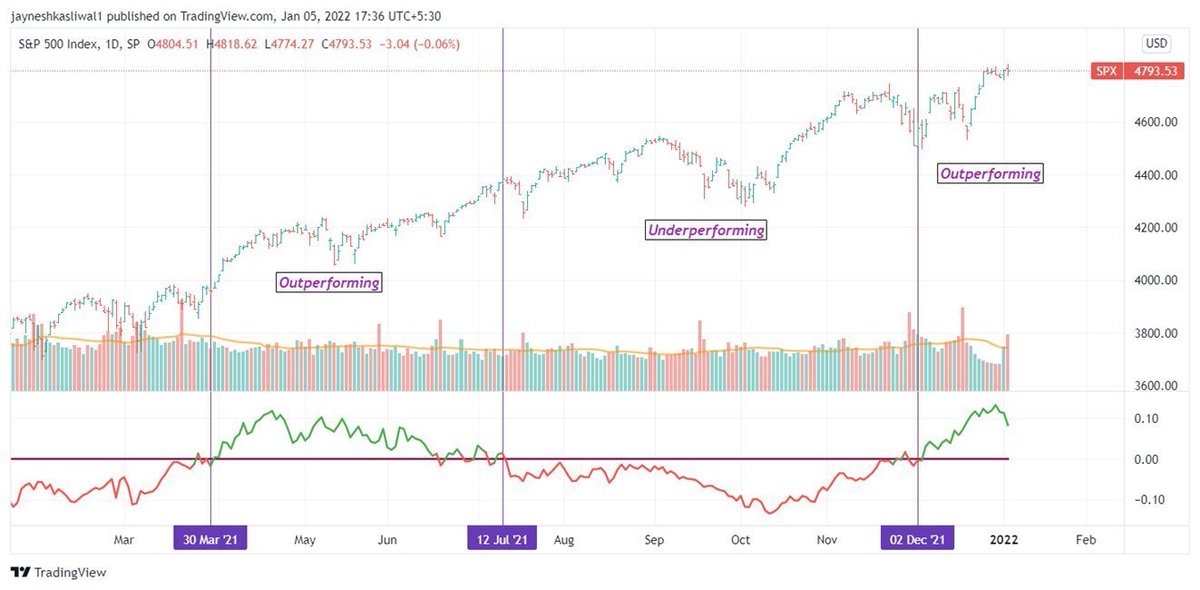
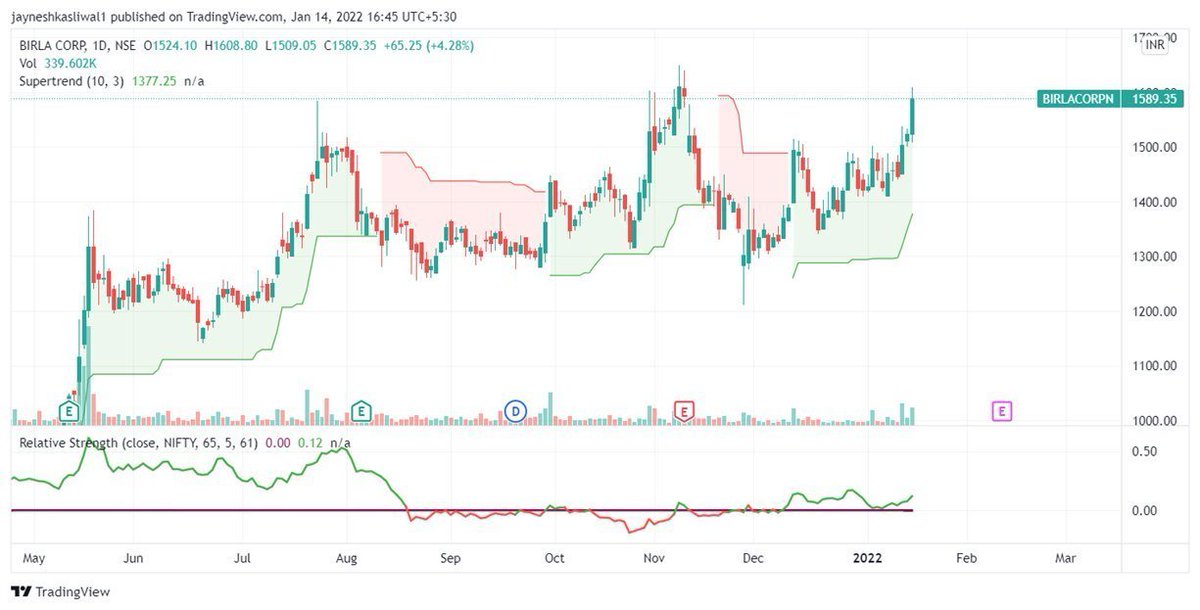
Conditions of Relative Strength
Relative Strength has a reference zero line
Line >0 Stock is Outperforming
Line <0 Stock is Underperforming
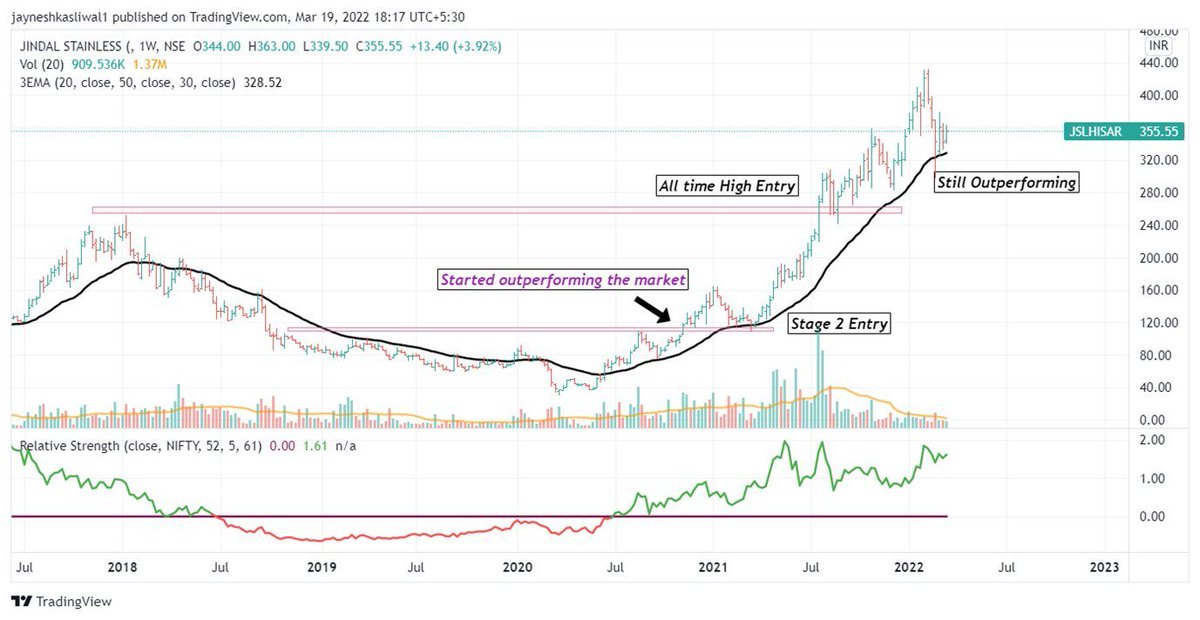
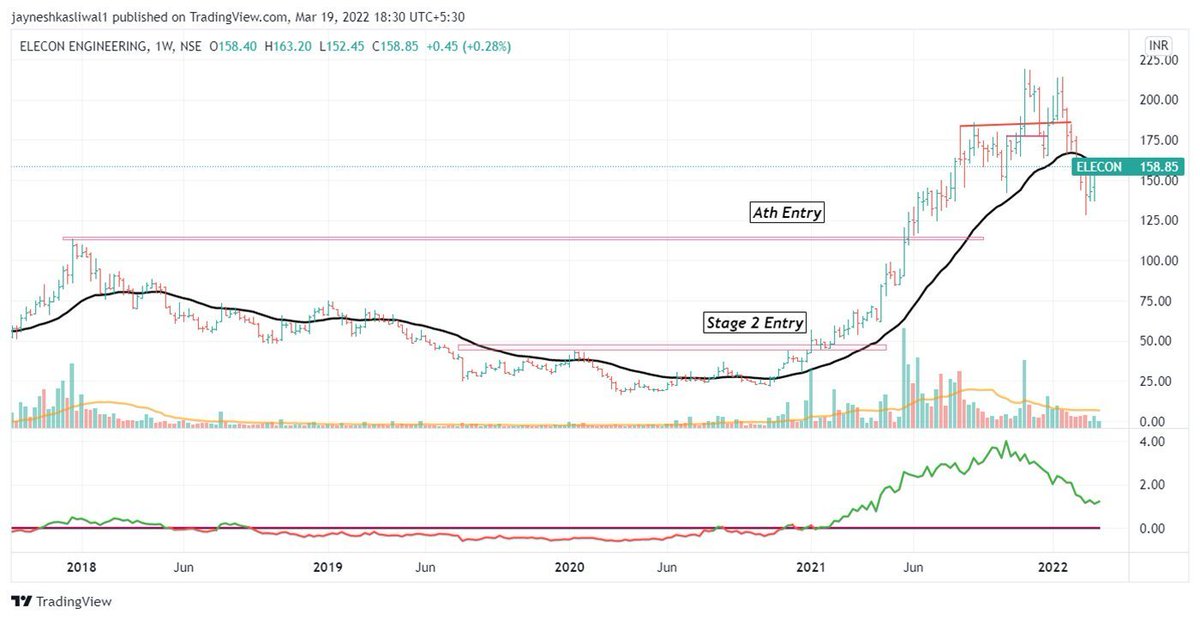
RS period 65 as we have around 65 trading days in 3 month
RS Period 52 in Weekly Time
RS reference as Nifty50 as benchmark index as
9/n
Relative Strength has a reference zero line
Line >0 Stock is Outperforming
Line <0 Stock is Underperforming
RS period 65 as we have around 65 trading days in 3 month
RS Period 52 in Weekly Time
RS reference as Nifty50 as benchmark index as
9/n
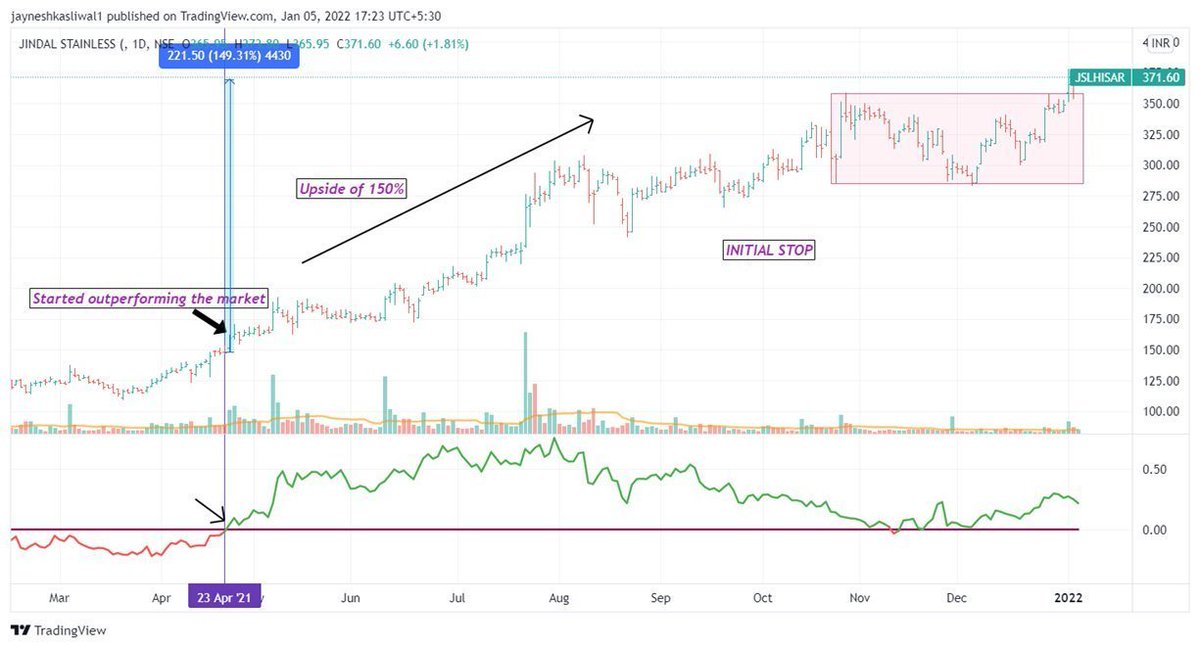
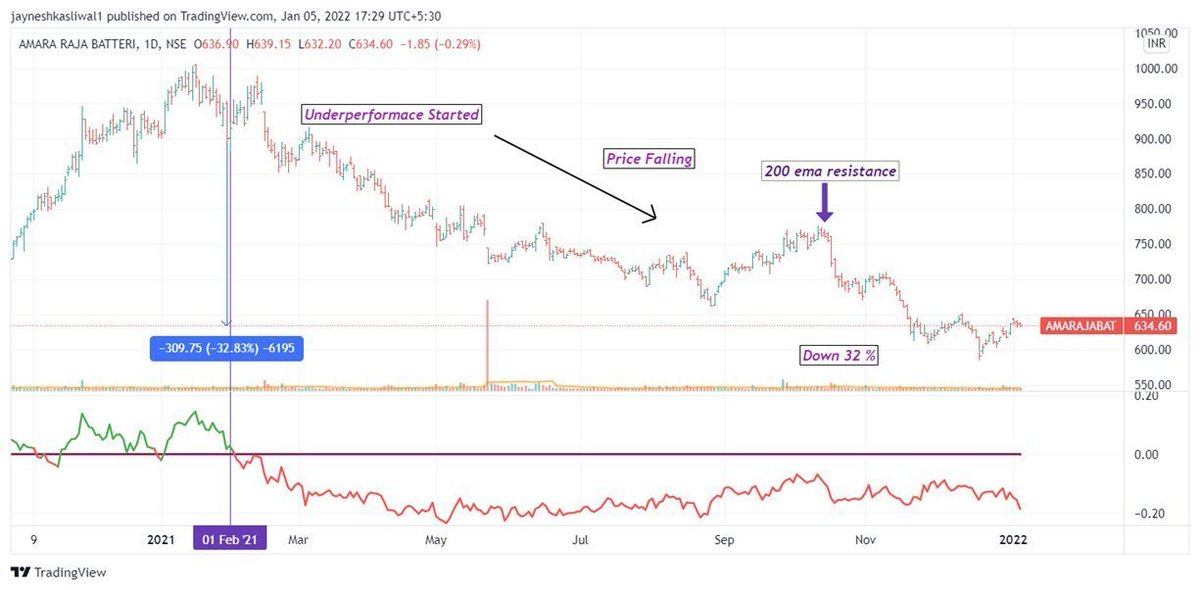
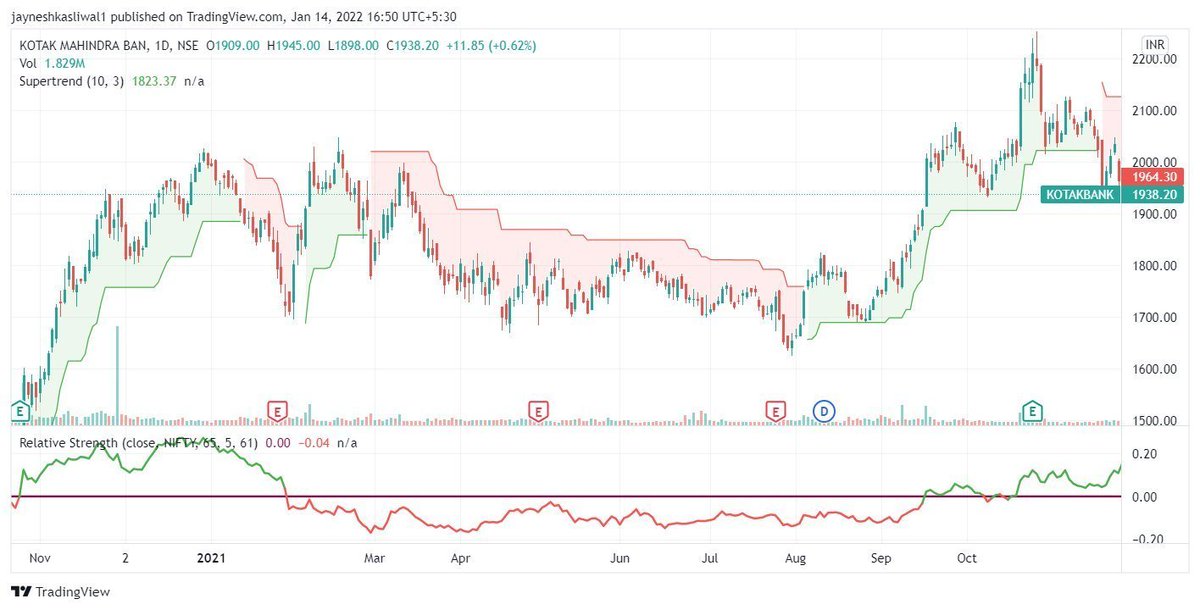
Keep Holding Stocks Till RS is positive to Stay in Complete Trend .
Use 52 on Weekly time Frame for Longer form of trading
Works well in all Markets and all Conditions
10/n
Use 52 on Weekly time Frame for Longer form of trading
Works well in all Markets and all Conditions
10/n
Youtube Video
" How to Sell a Stock ? "
" How to Sell a Stock ? "

MentorShip Program:
SWING TRADING MENTORSHIP GROUP!
✅Mentorship starting on 9th July on weekends only with recording
✅Covering Pure Price Action , Relative Strength, Stage Analysis, How to find Super Stocks
LINK FOR ENQUIRY:
wa.link/si4jn4
12/n
SWING TRADING MENTORSHIP GROUP!
✅Mentorship starting on 9th July on weekends only with recording
✅Covering Pure Price Action , Relative Strength, Stage Analysis, How to find Super Stocks
LINK FOR ENQUIRY:
wa.link/si4jn4
12/n

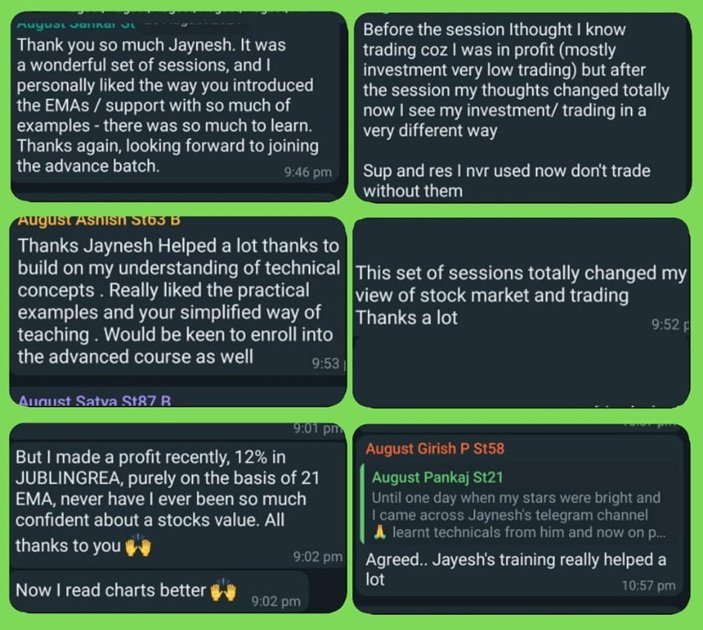
What Mentees have to say :
#Feedback
LINK FOR ENQUIRY:
wa.link/si4jn4
Payment Link :tagmango.app/4efa5b90c1
13/n
#Feedback
LINK FOR ENQUIRY:
wa.link/si4jn4
Payment Link :tagmango.app/4efa5b90c1
13/n

Stage Analysis Thread :
14/n
https://twitter.com/JayneshKasliwal/status/1492721206969061380?s=20&t=P-gSxOmrlWzh79rPd0Jbkg
14/n
I will be Sharing my Custom Made Portfolios on Trinkerr Platform which you can copy and track .
You have nothing to lose and everything to gain 💰
Install now - trin.kr/TechnoCharts
15/n
You have nothing to lose and everything to gain 💰
Install now - trin.kr/TechnoCharts
15/n
• • •
Missing some Tweet in this thread? You can try to
force a refresh