💪 Hello Coin Engineers!
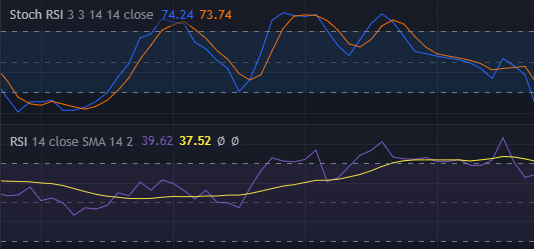
📌 In today's thread, we will talk about the idea behind the Stochastic RSI indicator.
💯 To spread the word, Like & Retweet!
#CryptoMarkets #cryptocurrency
📌 In today's thread, we will talk about the idea behind the Stochastic RSI indicator.
💯 To spread the word, Like & Retweet!
#CryptoMarkets #cryptocurrency
The Stochastic RSI (StochRSI) is an indicator used in technical analysis that ranges between zero and one and is created by applying the Stochastic oscillator formula to a set of relative strength index (RSI) values rather than to standard price data. 

Using RSI values within the Stochastic formula gives traders an idea of whether the current RSI value is overbought or oversold. The StochRSI is based on RSI readings. 

The RSI has a default input value, 14, which tells the indicator how many periods of data it is using in its calculation. These RSI levels are then used in the StochRSI formula. 

The StochRSI oscillator was developed to take advantage of both momentum indicators to create a more sensitive indicator that is attuned to a specific security's historical performance rather than a generalized analysis of price change. 

While the relative strength index was designed to measure the speed of price movements, the stochastic oscillator formula works best when the market is trading-in consistent ranges. 

Generally speaking, RSI is more useful in trending markets, and stochastics are more useful in sideways markets. 

Although the StochRSI and RSI utilize the same reversion concept, the latter relies on a different formula to compute RSI values. RSI derives its values from price, unlike StochRSI, which derives its values from itself. 

One key feature that sets the two technical indicators apart is how fast they move. StochRSI's movement is more rapid from overbought to oversold than that of RSI. 

Other than identifying trading opportunities, the StochRSI can predict short-term trends. Traders define price reversals and price turns using an oscillator that moves with a defined range within a centerline of 0.5.
Generally, the securities are trading higher when the StochRSI reading exceeds 0.5 during a trading range. However, a value below 0.5 means that assets are trading lower. 

The Stochastic RSI can also be used alongside other technical indicators to provide price divergence signals and enhance effectiveness. Divergence offers insightful clues regarding the movement of the near-future momentum.
Overbought doesn't necessarily mean the price will reverse lower, just like oversold doesn't mean the price will reverse higher. Rather the overbought and oversold conditions simply alert traders that the RSI is near the extremes of its recent readings. 

📍 That is the end of today's thread.
🥳 Don't forget to Like & Retweet to spread the word!
🥳 Don't forget to Like & Retweet to spread the word!
• • •
Missing some Tweet in this thread? You can try to
force a refresh


