1. The Double Bottom:
A trend reversal pattern.
Two lows of similar levels are formed.
ENTRY:
BO of the Neckline shows trend reversal by forming a Higher swing high which is also the entry point.
SL: LOD or swing low at a lower TF
TARGET:
Height of the NL to B1
Eg: #GRANULES
A trend reversal pattern.
Two lows of similar levels are formed.
ENTRY:
BO of the Neckline shows trend reversal by forming a Higher swing high which is also the entry point.
SL: LOD or swing low at a lower TF
TARGET:
Height of the NL to B1
Eg: #GRANULES

2. The Volatility contraction pattern, VCP by Mark Minervini
After a prior uptrend, a stock digests its gains, and profit taking happens. It then bases and gets ready for the next uptrend. VCP is a characteristic of a constructive base. It has the following characteristics:
1/n
After a prior uptrend, a stock digests its gains, and profit taking happens. It then bases and gets ready for the next uptrend. VCP is a characteristic of a constructive base. It has the following characteristics:
1/n
VCP cont..
Contraction in:
1. price range of successive swing high lows from left to right.
2. time-taken for each contractions from left to right.
3. Volumes from left to right.
Price breaks out with an explosion in volatility with volumes post 3/4 contractions.
2/n
Contraction in:
1. price range of successive swing high lows from left to right.
2. time-taken for each contractions from left to right.
3. Volumes from left to right.
Price breaks out with an explosion in volatility with volumes post 3/4 contractions.
2/n
All Triangles post an uptrend are VCPs,
eg, #TATAELXSI building a SYMMETRICAL TRIANGLE PATTERN and showing VCP.
Note: Symm. T can break out on either side.
Buy above PIVOT point, above the DTL = 8336
SL Swing low = 7590 (or entry days low)
3/3
eg, #TATAELXSI building a SYMMETRICAL TRIANGLE PATTERN and showing VCP.
Note: Symm. T can break out on either side.
Buy above PIVOT point, above the DTL = 8336
SL Swing low = 7590 (or entry days low)
3/3

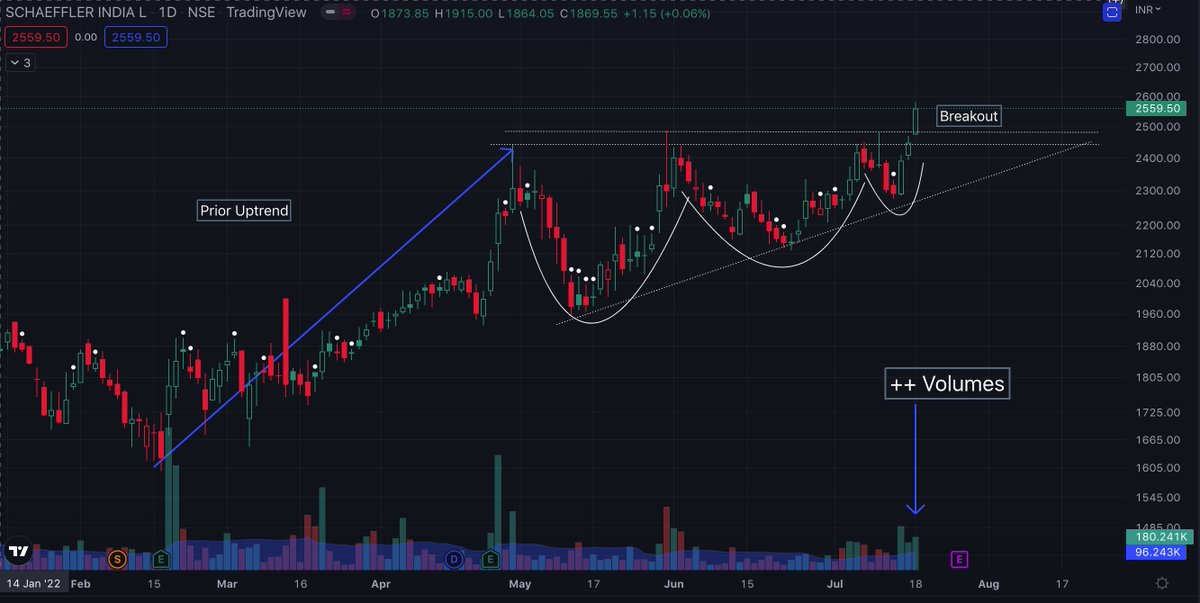
3. Ascending Triangle pattern.
Resistance is a horizontal line.
Support is an up-trending line.
Note the VCP inside the pattern.
Entry at Breakout above the Resistance.
BO with Volumes tends to be more successful.
SL = LOD or swing low.
eg: #SCHAEFFLER
Resistance is a horizontal line.
Support is an up-trending line.
Note the VCP inside the pattern.
Entry at Breakout above the Resistance.
BO with Volumes tends to be more successful.
SL = LOD or swing low.
eg: #SCHAEFFLER

4. Flag Pattern.
Pattern looks like a flag.
Has a pole (prior uptrend) and a Mast (retracement due to profit taking).
Constructive Flags must have a volume dry-up during the mast formation.
Entry = Break of DTL (volume on BO is necessary).
SL = Swing low or LOD
#SCHEFFLER
Pattern looks like a flag.
Has a pole (prior uptrend) and a Mast (retracement due to profit taking).
Constructive Flags must have a volume dry-up during the mast formation.
Entry = Break of DTL (volume on BO is necessary).
SL = Swing low or LOD
#SCHEFFLER

5. A Falling Wedge.
Price bounces between two downward sloping trendlines which are converging.
They have a Bullish bias post an uptrend (but can break either side).
Entry = Break of Resistance line (+ Volumes better).
SL = LOD or below Support line.
#Caplinpoint
Price bounces between two downward sloping trendlines which are converging.
They have a Bullish bias post an uptrend (but can break either side).
Entry = Break of Resistance line (+ Volumes better).
SL = LOD or below Support line.
#Caplinpoint

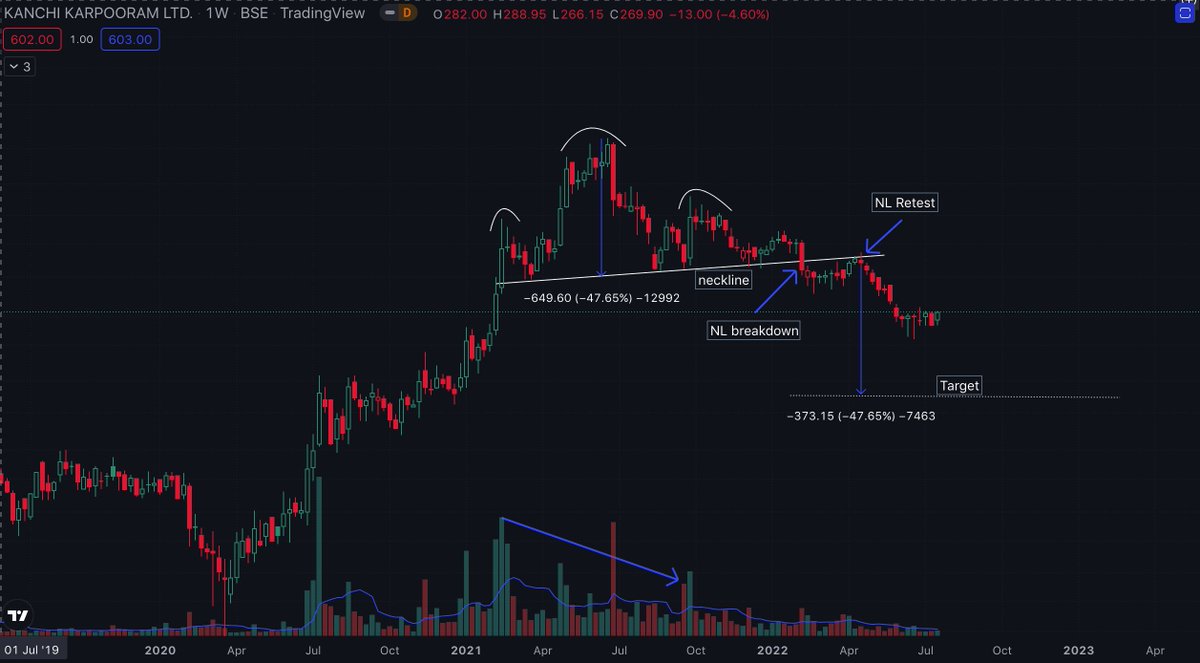
6. The Head and Shoulder Pattern.
1 of the most reliable reversal patterns.
A trend change from HL-HH to LH-LL (marked on chart).
Line joining 2 lows forms the neckline.
Trade entry = breakdown of NL
Target = (HH-NL) subtended downwards from breakdown.
1/n
1 of the most reliable reversal patterns.
A trend change from HL-HH to LH-LL (marked on chart).
Line joining 2 lows forms the neckline.
Trade entry = breakdown of NL
Target = (HH-NL) subtended downwards from breakdown.
1/n

Volume profile of a good HnS.
1. Head has lower volume than LS
2. RS has an even lower volume than Head
eg: #KANCHI
2/2
1. Head has lower volume than LS
2. RS has an even lower volume than Head
eg: #KANCHI
2/2

7. Cup and Handle pattern. 2T
https://twitter.com/Sakatas_Homma/status/1550464199892934656?s=20&t=UPgQD4R7N2OWzQEmrFOPOw
8. Inverse Triangles/ Broadening wedges/ Megaphones
They generally have a bearish bias long-term.
Form consecutive Higher High and higher lows.
swing traders can initiate trades at the reversal points on either side.
eg: #INDIAGLYCOL
has a 20% upside after the flag breakout
They generally have a bearish bias long-term.
Form consecutive Higher High and higher lows.
swing traders can initiate trades at the reversal points on either side.
eg: #INDIAGLYCOL
has a 20% upside after the flag breakout

beautiful HnS
https://twitter.com/Sakatas_Homma/status/1552894193286098944?s=20&t=1zL5kV6ookAOIF8OSpo6Hw
#VCP #UTTAMSUGAR
Latest contraction in price is around single digits. Hardly any room left for one more contraction.
This will release all the energy soon.
Latest contraction in price is around single digits. Hardly any room left for one more contraction.
This will release all the energy soon.

Another HnS with a downsloping Neckline.
They are more bearish than usual.
Beautiful, Target met.
#JUBLPHARMA
They are more bearish than usual.
Beautiful, Target met.
#JUBLPHARMA

9. The Flat Base Pattern.
Reliable, easier to spot, and easiest to manage risk.
Prices bounces between a rectangle for weeks before Breaking out above (or below, in a downtrend).
Entry: At the BO.
SL: below the BO candle.
target: height of the rectangle.
eg: #Wonderla
Reliable, easier to spot, and easiest to manage risk.
Prices bounces between a rectangle for weeks before Breaking out above (or below, in a downtrend).
Entry: At the BO.
SL: below the BO candle.
target: height of the rectangle.
eg: #Wonderla

10. The High Tight Flag/ The powerplay set-up.
one of my fav. as a swing trader.
A Flag with:
=>100% move in <8 weeks
correction of =<25% from the top.
Entry: Break of Flag DTL or flag top
SL: low of the swing low/mast low
Target: same as flag
Eg: SRHHPOLTD (not completed)
one of my fav. as a swing trader.
A Flag with:
=>100% move in <8 weeks
correction of =<25% from the top.
Entry: Break of Flag DTL or flag top
SL: low of the swing low/mast low
Target: same as flag
Eg: SRHHPOLTD (not completed)

• • •
Missing some Tweet in this thread? You can try to
force a refresh


