#Renewable Power Generation Costs in 2021 from @IRENA is out
The headline isn't quite what you'd expect:
The global weighted average cost of new #solar #photovoltaics (#PV), onshore and offshore #WindPower projects fell in 2021.
Despite rising equp. costs.
Lets see why 1/n
The headline isn't quite what you'd expect:
The global weighted average cost of new #solar #photovoltaics (#PV), onshore and offshore #WindPower projects fell in 2021.
Despite rising equp. costs.
Lets see why 1/n
@IRENA 1st up the data:
Year on year change:
⬇️LCOE of onshore wind projects added in 2021 fell by 15%, year-on-year, to USD 0.033/kWh
⬇️ Utility-scale solar PV and offshore wind LCOE fell by 13% year-on-year to USD 0.048/kWh & USD 0.075/kWh respectively
⬆️ CSP up 7% though
2/n
Year on year change:
⬇️LCOE of onshore wind projects added in 2021 fell by 15%, year-on-year, to USD 0.033/kWh
⬇️ Utility-scale solar PV and offshore wind LCOE fell by 13% year-on-year to USD 0.048/kWh & USD 0.075/kWh respectively
⬆️ CSP up 7% though
2/n

@IRENA This is despite rising equipment costs from the end of 2020, albeit unevenly.
Solar PV module prices in Europe up modestly in 2021, but looking to be 20% or more higher in 2022, given underlying materials and shipping cost increases, but perhaps more (more on that later...)
3/n
Solar PV module prices in Europe up modestly in 2021, but looking to be 20% or more higher in 2022, given underlying materials and shipping cost increases, but perhaps more (more on that later...)
3/n

@IRENA Similar situation for wind turbine prices, with the EXCEPTION of China (when isn't it u ask?)
There is quite a range, but a central value for the increase in 2021 over 2020 would be around USD 75/kW. Significiant, but not earth shattering on avg. total installed costs
4/n
There is quite a range, but a central value for the increase in 2021 over 2020 would be around USD 75/kW. Significiant, but not earth shattering on avg. total installed costs
4/n

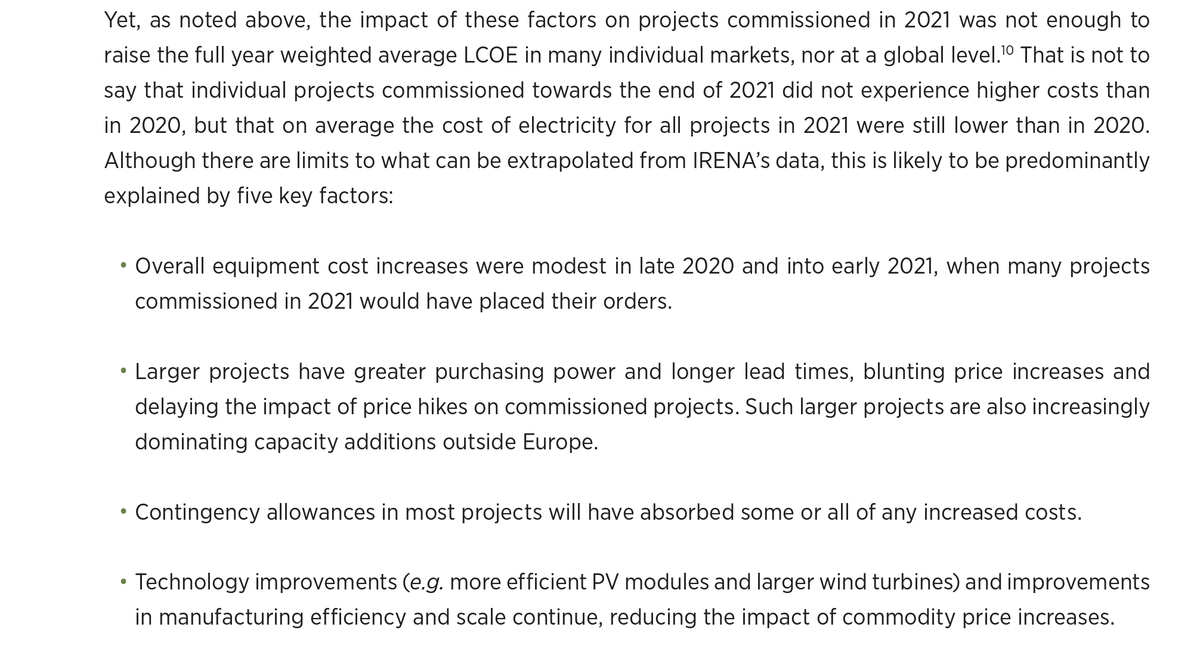
There are a number of explanations for this, but the key is the modest increases in early 2021, and the time lag that exists between the pass through of equip. pricing into total installed costs.
there is a signifcant lag between order placement and commisisoning of project.
5/
there is a signifcant lag between order placement and commisisoning of project.
5/

So we are reporting historical costs. A wind turbine order with one of the big manufacturers, will c u waiting perhaps 7-12 months before you get your turbine. PV modules often ordered with a shorter lag, but remains true that:
Total installed costs lag ⏭️equipment costs
6/
Total installed costs lag ⏭️equipment costs
6/
What does this mean? Given commodity and equipment costs will remain elevated in 2022, we are likely to see much stronger cost pass through in 2022. More markets are likely to experience increased installed costs, and tech improvements r going to be less able to offset...
7/
7/
In 2021, the country weighted average total installed costs of utility-scale solar PV increased year-on-year in three of the top 25 markets, while for onshore wind this was true of seven of the top 25 markets in 2021.
In 2022, those numbers are likely to increase.
8/
In 2022, those numbers are likely to increase.
8/
But lets not get ahead of ourselves
The trend 2010 to 2021 is quite remarkable
tech improvements, economies of scale, competition, supply chains & experience have all contributed to falling costs.
2010-21
PV ⬇️ -88%
CSP & onshore wind ⬇️-68%
Offshore wind ⬇️-60%
9/
The trend 2010 to 2021 is quite remarkable
tech improvements, economies of scale, competition, supply chains & experience have all contributed to falling costs.
2010-21
PV ⬇️ -88%
CSP & onshore wind ⬇️-68%
Offshore wind ⬇️-60%
9/

It means that increasingly, renewables are competing head-to-head and beating fossil fuels on cost (but mkt structures r going to need to change, another topic).
Two-thirds of all capacity added in 2021 had costs lower than the cheapest fossil option in G20.
10/
Two-thirds of all capacity added in 2021 had costs lower than the cheapest fossil option in G20.
10/

in 2017, virtually no utility-scale PV had costs lower than the cheapest fossil fuel option, but last year 70% of the estimated utility-scale additions beat that benchmark.
A remarkable achievement.
As recently as 2016, only 16% of onshore wind projects did, last year 96%
11/
A remarkable achievement.
As recently as 2016, only 16% of onshore wind projects did, last year 96%
11/
As our DG @flacamera said in his Foreword:
If ever there was a year to dramatically increase the deployment of #RE power generation, it is 2022. Renewables will reduce fossil import bills & lessen the damaging impacts of high electricity prices on consumers and industry.
12/12
If ever there was a year to dramatically increase the deployment of #RE power generation, it is 2022. Renewables will reduce fossil import bills & lessen the damaging impacts of high electricity prices on consumers and industry.
12/12
@threadreaderapp do your magic unroll
• • •
Missing some Tweet in this thread? You can try to
force a refresh


