If it looks like a duck, swims like a duck, and quacks like a duck, then it probably is a duck!
The duck test, which shows how apparent things can be, fails when it comes to data.📊
A 🧵 on dealing with #MutualFund numbers, so you don’t commit financial mistakes.👇
The duck test, which shows how apparent things can be, fails when it comes to data.📊
A 🧵 on dealing with #MutualFund numbers, so you don’t commit financial mistakes.👇
1⃣ Same returns from different funds don’t mean the similar performance
Say, 2 funds have delivered 10% average annual returns in the past 10 years.
If you would pick a fund on these numbers, there are 50% chances of you going wrong.❌
The chart explains the difference. 👇
Say, 2 funds have delivered 10% average annual returns in the past 10 years.
If you would pick a fund on these numbers, there are 50% chances of you going wrong.❌
The chart explains the difference. 👇

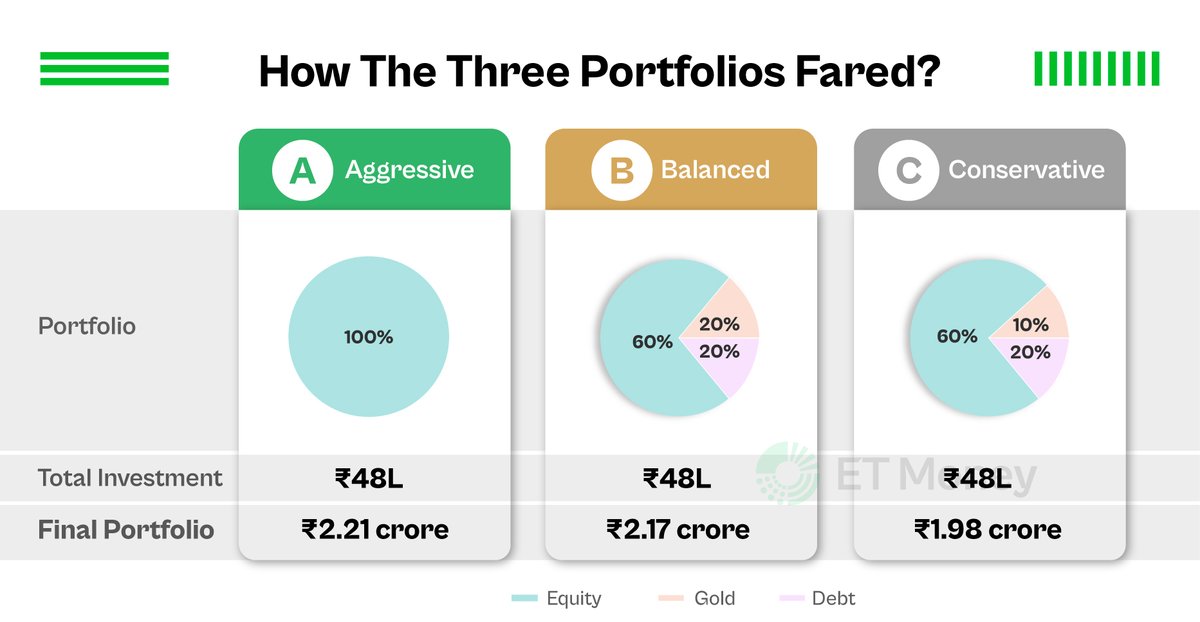
A volatile fund would have some phases of high performance and extended periods of underperformance. 📈📉
It doesn’t make sense to go for the volatile fund, as it would pose problems when you want to exit the fund.
Also, you are taking unnecessary risks to get the same returns.
It doesn’t make sense to go for the volatile fund, as it would pose problems when you want to exit the fund.
Also, you are taking unnecessary risks to get the same returns.
2⃣ Long-term returns can be misleading!
Typically, long-term returns show a comprehensive picture of a fund’s performance.
But if you simply make a decision by looking at 10-year or 15-year #returns, you may end up picking funds not suitable to your risk appetite.
Typically, long-term returns show a comprehensive picture of a fund’s performance.
But if you simply make a decision by looking at 10-year or 15-year #returns, you may end up picking funds not suitable to your risk appetite.
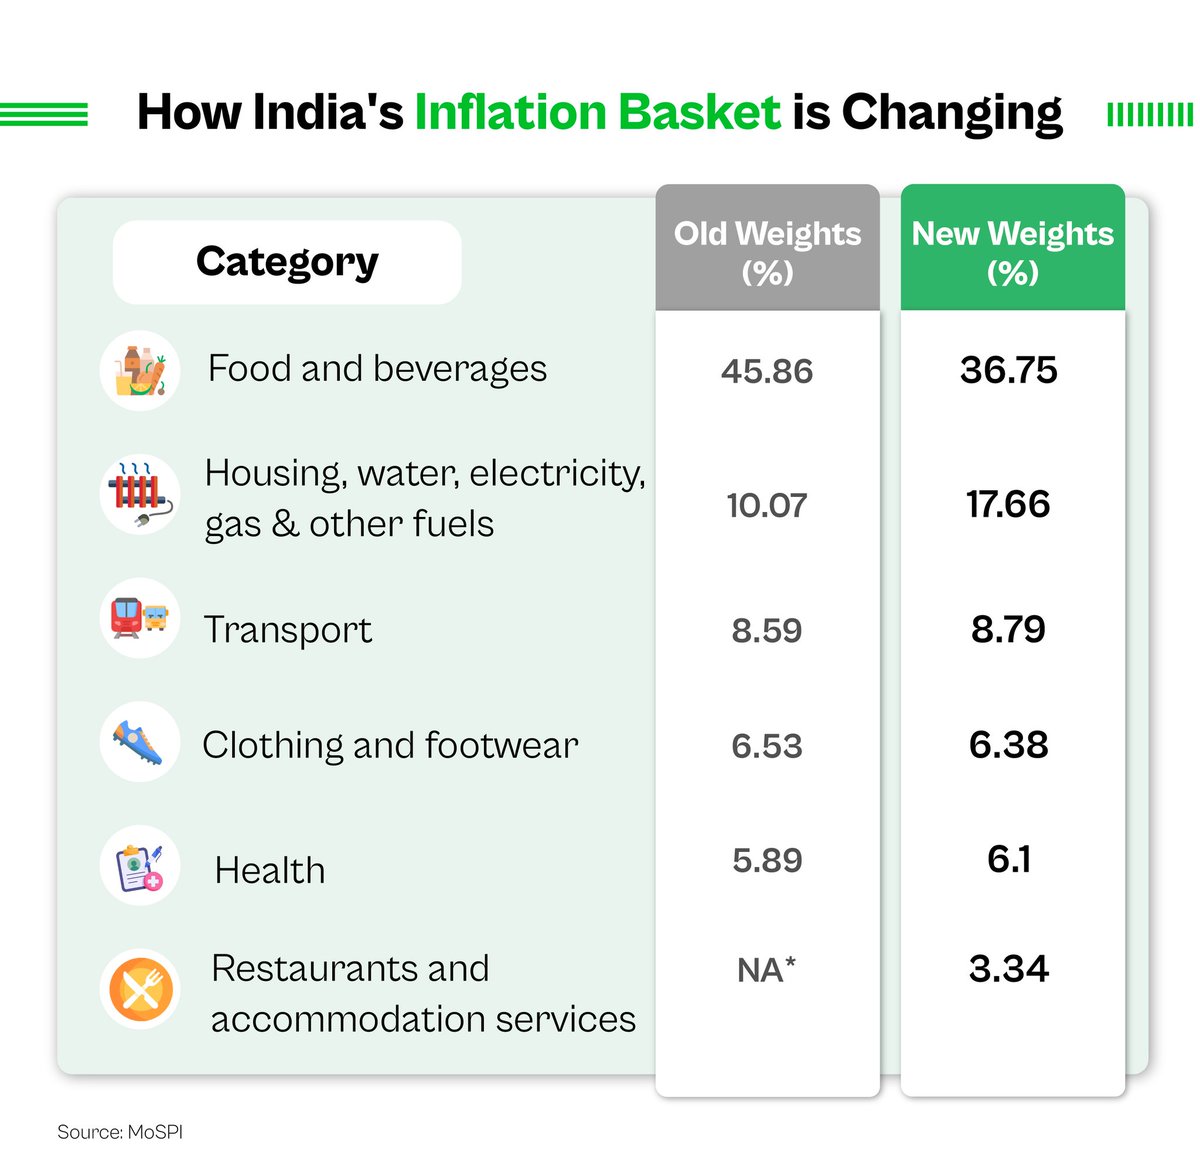
The table shows that 3 of the top 5 categories are either thematic or sectoral.
But these returns are not useful for assessing sectoral and thematic funds.
These funds are extremely volatile. And you don’t know when the cycle will turn in their favour or against them. ⏬
But these returns are not useful for assessing sectoral and thematic funds.
These funds are extremely volatile. And you don’t know when the cycle will turn in their favour or against them. ⏬

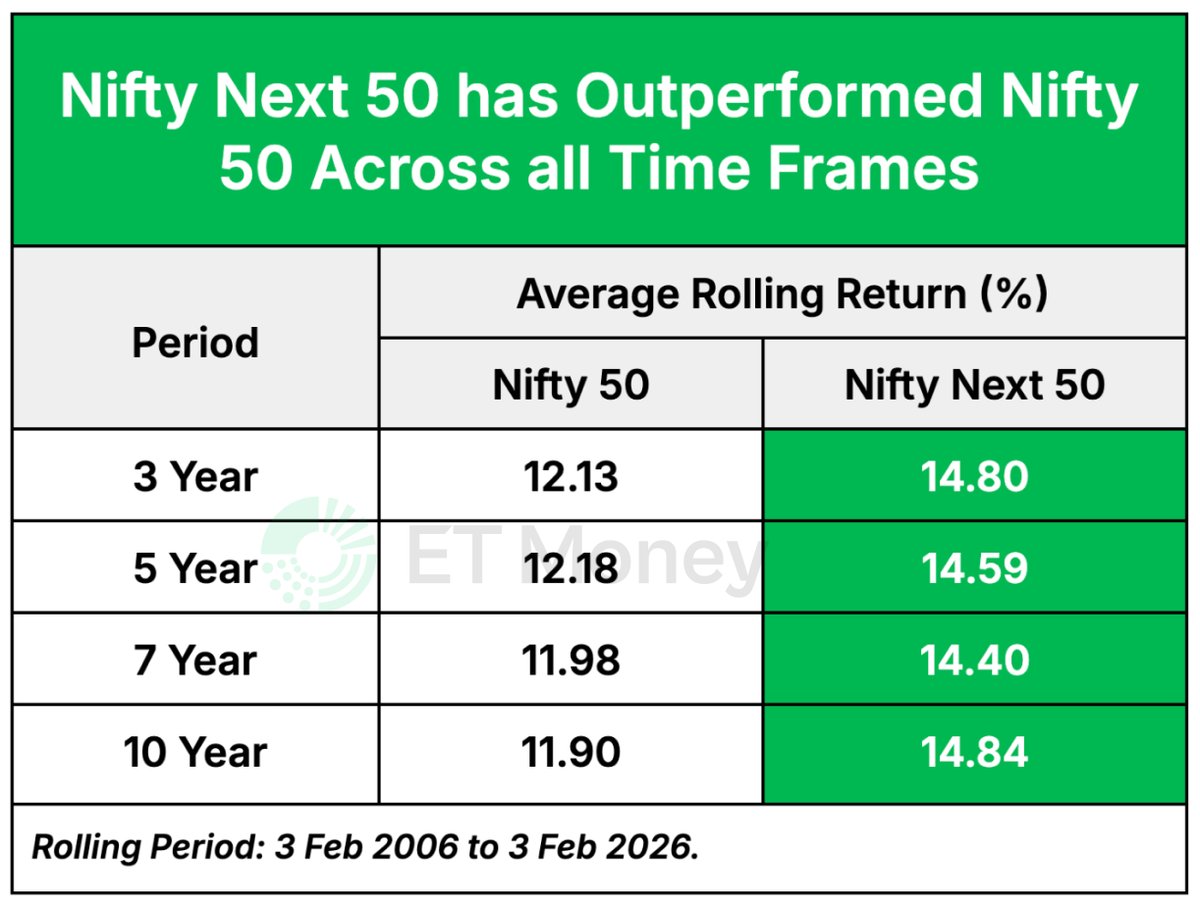
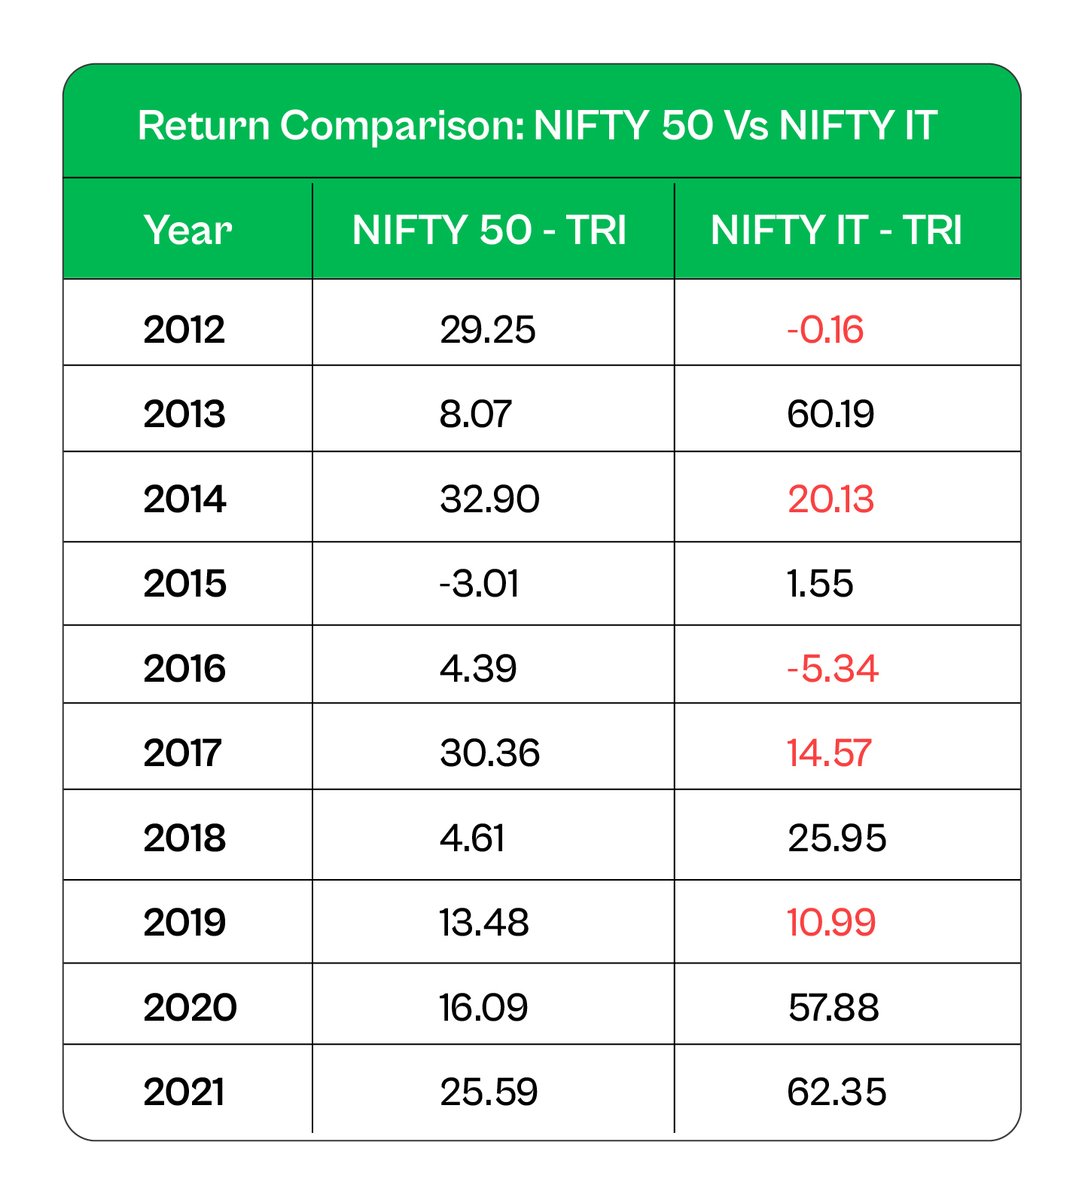
For e.g., now technology funds are topping the charts for 10-year returns.
But in 5 out of the last 10 years, the index has underperformed #NIFTY50.
The point is sectoral funds manage these outsized returns during their cycles, and it reflects in their history.
But in 5 out of the last 10 years, the index has underperformed #NIFTY50.
The point is sectoral funds manage these outsized returns during their cycles, and it reflects in their history.
3⃣ Low NAV doesn’t mean it’s cheap.
Many think a fund with a low NAV is better.
Such investors feel low NAV will help them get more units and that can translate to higher returns.
Following the same logic, may buy NFOs as they get each unit of a scheme at Rs 10
Many think a fund with a low NAV is better.
Such investors feel low NAV will help them get more units and that can translate to higher returns.
Following the same logic, may buy NFOs as they get each unit of a scheme at Rs 10
The truth is high or low NAV doesn’t matter.
Here’s a real-life example.
Say 3 years ago, on July 1, 2021, you invested in 2 Flexi Cap Funds:
👉Axis Flexi Cap Fund (lower NAV)
👉PPFAS Flexi Cap Fund (higher NAV).
See how your investments would have panned out ⏬
Here’s a real-life example.
Say 3 years ago, on July 1, 2021, you invested in 2 Flexi Cap Funds:
👉Axis Flexi Cap Fund (lower NAV)
👉PPFAS Flexi Cap Fund (higher NAV).
See how your investments would have panned out ⏬

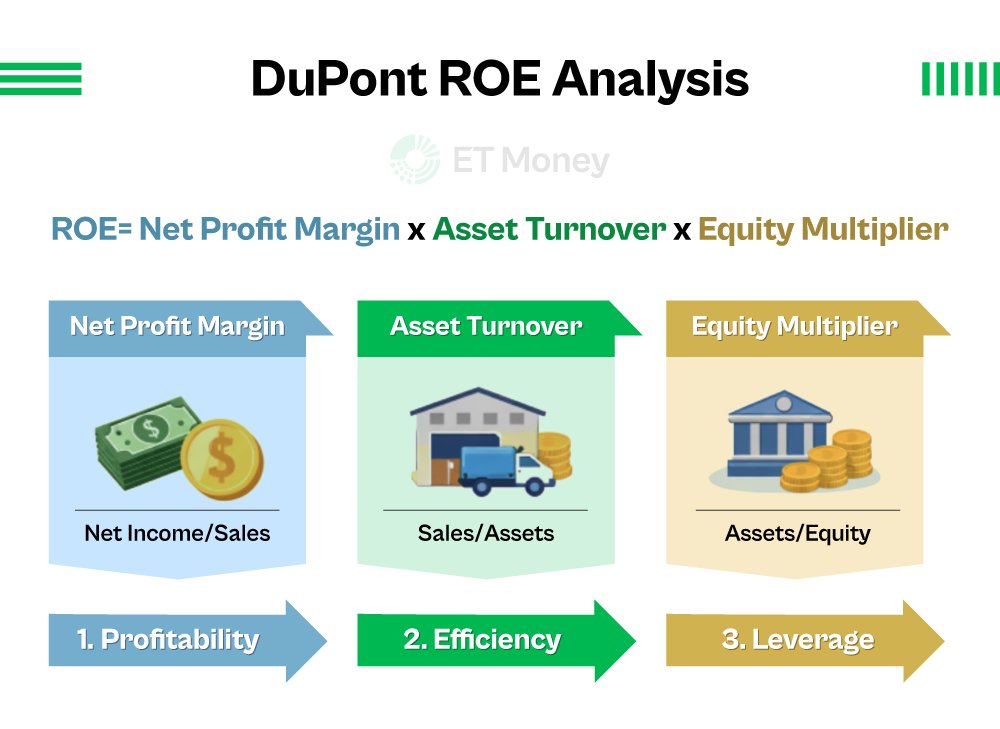
In Axis Flexi Cap Fund, you got more than 2X units than PPFAS Flexi Cap Fund!
Yet, gains are considerably higher in PPFAS Flexi Cap Fund.
It shows low or high NAV has nothing to do with a fund’s potential. The rate of return you get from a scheme is all that matters.✅
Yet, gains are considerably higher in PPFAS Flexi Cap Fund.
It shows low or high NAV has nothing to do with a fund’s potential. The rate of return you get from a scheme is all that matters.✅
4⃣ Index Funds vs ETFs
ETFs are a great product to follow an index (passive investing).
In fact, some ETFs are better than index funds as they have a lower expense ratio and lesser tracking error.
ETFs are a great product to follow an index (passive investing).
In fact, some ETFs are better than index funds as they have a lower expense ratio and lesser tracking error.

However, there are a few times when ETFs turn out to be more expensive.
Some niche ETFs don’t have enough demand. So they trade at a premium which can add to their cost.
Take this into consideration, especially before investing in a niche ETF.
Some niche ETFs don’t have enough demand. So they trade at a premium which can add to their cost.
Take this into consideration, especially before investing in a niche ETF.
If you learned something new, like, share, and retweet the first tweet to help us reach more readers.😇
For more such threads, follow us.👇
Also, click on the bell icon in the profile section so you don’t miss any thread.
For more such threads, follow us.👇
Also, click on the bell icon in the profile section so you don’t miss any thread.
• • •
Missing some Tweet in this thread? You can try to
force a refresh