#Lesson1: Candlestick Origin, History, Purpose, Basic and its Takeways
✅Origin & History:-The first and foremost people to use past prices to predict future price movements was the legendary Munehisa Homma. He amassed a huge fortune trading in the rice market during the 1700s.
✅Origin & History:-The first and foremost people to use past prices to predict future price movements was the legendary Munehisa Homma. He amassed a huge fortune trading in the rice market during the 1700s.

He is regarded as the father of candlestick in modern day.
✅What is called 'Candlestick'?
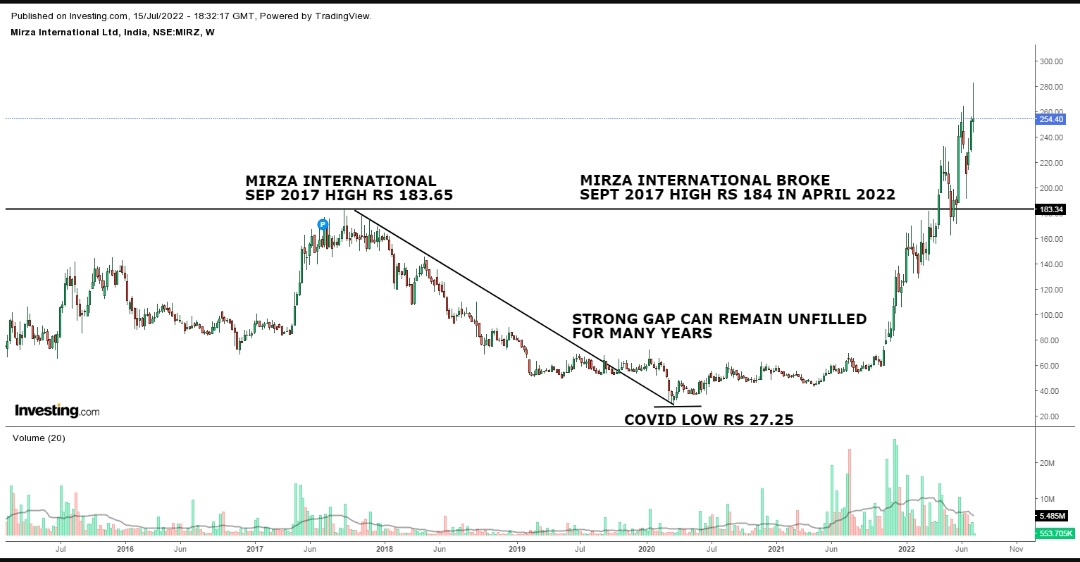
A candlestick is a type of price chart used in technical analysis that displays the high, low, open, and closing prices of a security for a specific period.
✅What is called 'Candlestick'?
A candlestick is a type of price chart used in technical analysis that displays the high, low, open, and closing prices of a security for a specific period.
The rectangular part of the candlestick is called the 'real body' and tells investors and traders whether the closing price was higher or lower than the opening price (black/red if the stock closed lower, white/green if the stock closed higher).


✅Purpose:- Candlesticks reflect the impact of investor sentiment on security prices and are used by technical analysts to determine when to enter and exit trades.
✅Basic:- Long white/green candlesticks indicate there is strong buying pressure; this typically indicates price
✅Basic:- Long white/green candlesticks indicate there is strong buying pressure; this typically indicates price
is bullish. Long black/red candlesticks indicate there is significant selling pressure. This suggests the price is bearish.
✅Takeaways:- The rectangular sections of the candlestick is called the 'real body'. The real body represents the range between sessions open and close.
✅Takeaways:- The rectangular sections of the candlestick is called the 'real body'. The real body represents the range between sessions open and close.
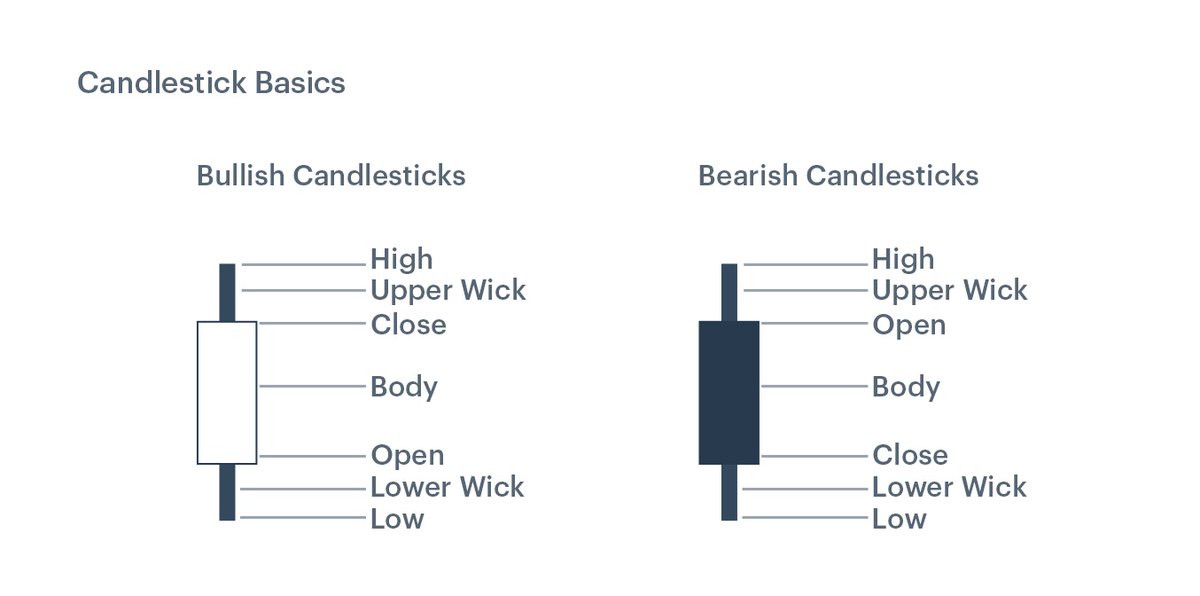

✅When the real body is Black/Red, it means close of the session was lower than the open.
✅If the real body is white/green, it shows that close was higher than the open.
✅The thin line above and below the real body are called shadows or wick. The shadow above the real body is
✅If the real body is white/green, it shows that close was higher than the open.
✅The thin line above and below the real body are called shadows or wick. The shadow above the real body is
Called upper shadow and the shadow below the real body is called lower shadow.
✅The peak of the upper shadow is the high of the session and the bottom of the lower shadow is the low of the session.
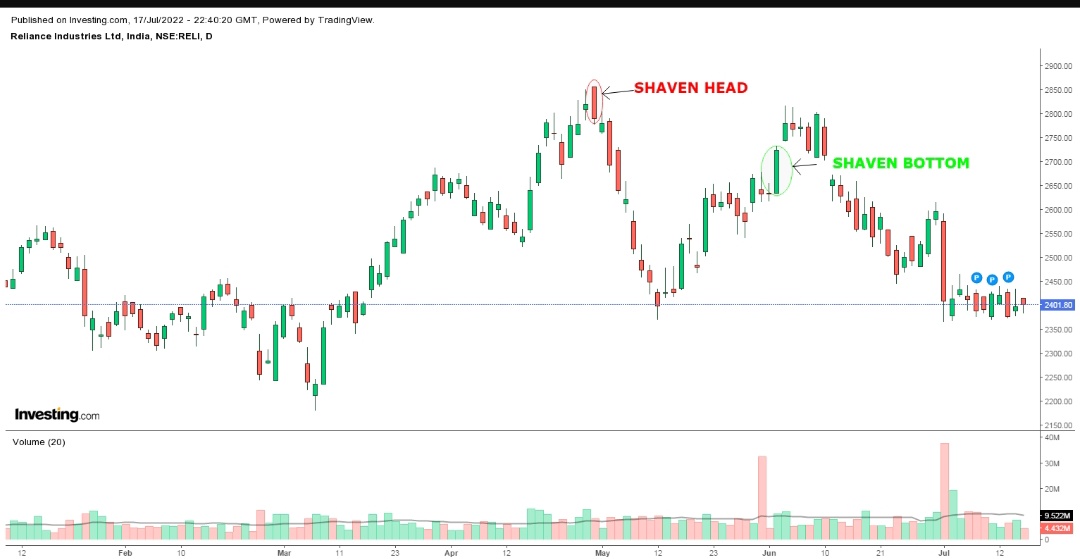
✅If the candle has no upper shadow, it is said to have a shaven head.
✅The peak of the upper shadow is the high of the session and the bottom of the lower shadow is the low of the session.
✅If the candle has no upper shadow, it is said to have a shaven head.
A candle with no lower shadow has a shaven bottom. Note:Look at 'Shaven Head' and 'Shaven Bottom' in below picture.
✅Point to remember:- The Real Body is the essence of price movement. This reflects a central concept about the power of the real body. By looking at the height and the colour of the real body, we can get an immediate visual clue weather it's the bulls or the bears who are in

Control. A practical application of the real body using its size is the barometer of the market's movement.
Tags: @kuttrapali26
*---------------------*
Tags: @kuttrapali26
*---------------------*
• • •
Missing some Tweet in this thread? You can try to
force a refresh