Mike Hoerger, PhD MSCR MBA Profile picture
Jul 19, 2022 12 tweets 9 min read Read on X
Top 10 tips everyone should know about wearing #N95 & #elastomeric masks.

What did I miss?

THREAD! Image
Tip #1: Masks buy time. Context matters too: Ventilation (HVAC/outdoor air), filtration (HEPA), & ⬇️ people buy more time.

The longer you’ll be someplace or the worse the context, the better the mask you’ll need.

In a “typical” setting, you might expect this (per @akm5376): Image
Tip #2: If you’re going to be someplace a long time (home, office, hospital, wedding), open windows, add #HEPA, turn HVAC from ‘auto’ to ‘on' & do testing.

BOOM, you just improved your mask. Better context = less work for the mask.

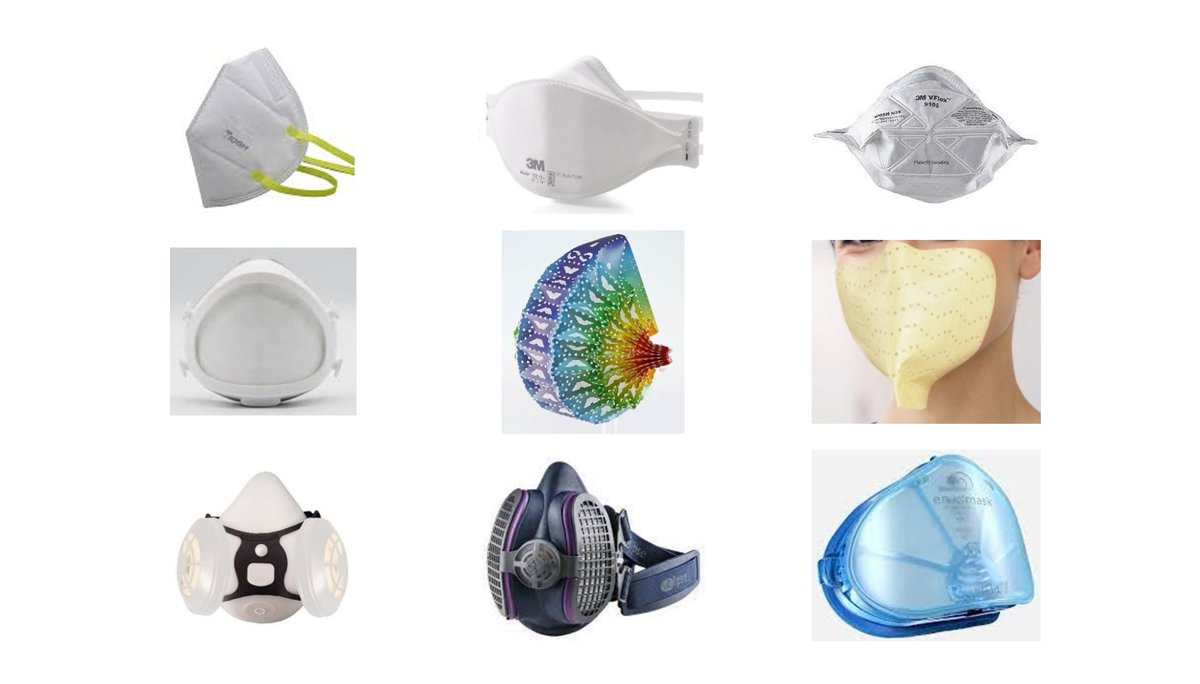
Tip #3: These are my three fav N95s. The Aegle & 3M Aura are good for most adult size faces. The Vflex is good for larger faces. I think 80-90% would be happy with the Aura.

What’s your fav #N95 and why?

Tip #4: Have a unique concern? There’s an N95 for you. Just ask.

For example, a lot of people like the Airgami if they have COPD or other breathing challenges.

The Readimask is good for MRIs, haircuts, or dental visits.
Image
Tip #5: Do a quick #N95 seal check each time. Fit the nose piece using both hands. Exhale a deep breath to check for obvious leaks.

Read the instructions that came w/them, e.g., the 3M Aura or Vflex should be pulled back taut under the chin, not loose.

cleanaircrew.org/masks/#How_to_…
Tip #6: At low cost, you can fit-test an N95.

Buy a nebulizer & sweet (called FT-31) or bitter (FT-32) fit testing solution. The nebulizer vaporizes the solution. If you can taste it, your mask has gaps.


Tip #7: N95s are great, but for a better fit, try an “#elastomeric.”

That’s just a reusable elastic-band type mask.

Twitter search “elastomeric” for recs & sizing. Good ones: GVS models ($), @DentecSafety ComfortAir ($), @flo_mask ($$, adult & kid’s size), & Envo mask ($$) Image
Tip #8: Always buy directly from the manufacturer, a nonprofit like @projectn95, or a verified sourced. For example, Amazon sells a ton of fakes, but GVS is verified to sell authentically via Amazon. Do your homework.

Any questions on where to buy?

projectn95.org
Tip #9: Share the wealth. You can give away N95s to your family, friends, co-workers, patients, clinicians, & community.

Share these tips too. RT 🔁or post these tips on legacy platforms like Facebook Image
FYI, I have no COIs, including no investment in any company listed. I’m a multidisciplinary scientist. My goal is to pass along advice from experts in a way that’s more relatable to communities.

• • •

Missing some Tweet in this thread? You can try to force a refresh
 

Keep Current with Mike Hoerger, PhD MSCR MBA

Mike Hoerger, PhD MSCR MBA Profile picture

Stay in touch and get notified when new unrolls are available from this author!

Read all threads

This Thread may be Removed Anytime!

PDF

Twitter may remove this content at anytime! Save it as PDF for later use!

Try unrolling a thread yourself!

how to unroll video
  1. Follow @ThreadReaderApp to mention us!

  2. From a Twitter thread mention us with a keyword "unroll"
@threadreaderapp unroll

Practice here first or read more on our help page!

More from @michael_hoerger

Mar 1
31 Reasons Why the New 1-Day COVID Isolation Policy is Wrong

#1
Experts in modeling and testing know that people are infectious with COVID for an average of 7 days, with substantial variability around that average.

"31 Reasons Why the New 1-Day COVID Isolation Policy is Wrong"
#2
People use defense mechanisms to temporarily avoid the death anxiety evoked by thinking of COVID. The too-short 5-day iso was an example of this (see final example).

Such defenses provide temporary relief and are almost always harmful long-term.
#3
Dropping isolation policies to 1 day will predominantly harm people in poor-ventilation environments.

Restaurants have 35-50x less ventilation than the ASHRAE standards, so this will harm the service industry and unsuspecting “brunch class.”
Read 31 tweets
Feb 29
PMC COVID-19 Forecast, Week of Feb 26, 2024
1 of 5 🧵

Forecast for the next month
Over the next month, we should see transmission fall from 790,000 infections/day toward more like a range of 200,000-450,000 infections per day, depending on better or worse scenarios.

That's "good" news in the relative sense for those putting off medical appointments the past 6 months, though still extremely high transmission in any objective sense.

See the online report for details on the models.

Surge in Context
At this point in the surge, it is clear that the peak transmission day was around December 27 (1.92 million/day), and the midpoint of “surging” infections (>1 million/day) was around January 9.

We are estimated to have had 85 total days with >1 million infections per day (November 28 through February 20) during the surge, though these numbers may still fluctuate with corrections the next few weeks.

The low-point leading into the surge was October 18 at 547,000 infections/day. Infections have been at “wave” levels (>500,000 infections/day or higher) since the onset of the late summer wave surpassed that milestone on July 27. We are estimated to dip below 500,000 infections/day around March 6.

This is very unfortunate timing because the medical facilities that enacted universal masking may end policies on March 1. Many were hoping for a period of lower transmission before such policies ended. As of today, the estimated low point for transmission is March 27 (348,000 infections/day), but the level and date are subject to much uncertainty.CURRENT ESTIMATES FOR February 26, 2024 Wastewater Levels (copies/mL) 546 New Daily Cases 794,000 % of Population Infectious 1.66% (1 in 60 people) New Daily Long COVID Cases  40,000 to 159,000   4-WEEK FORECAST FOR March 25, 2024 Wastewater Levels (copies/mL) 242 (-56% lower) New Daily Cases 353,000 % of Population Infectious 0.74% (1 in 135 people) New Daily Long COVID Cases  18,000 to 71,000
PMC COVID-19 Forecast, Week of Feb 26, 2024
2 of 5 🧵

Current State of the Pandemic
🔹73 million infections in the U.S. in 2024 (so far)
🔹790,000 daily infections
🔹1.66% (1 in 60) actively infectious
🔹40,000+ resulting #LongCOVID cases/day

Deeper Dive
Transmission is finally starting to decline again, and expect major declines the next four week.

U.S. wastewater levels indicate that COVID transmission is higher than during 58.4% of the days of the pandemic (down from 85.9% a week ago). Transmission is lower than 41.6% of the pandemic.

As we noted the past two weeks, we believed the post-peak hill was itself peaking on around February 7th and that last week’s slightly higher values might get retroactively corrected downward. That was, in fact, the case (the peak was the 7th), and transmission has fallen further since.

We are still at very high “wave” levels, but no longer “surging” at over a million infections/day. The big picture remains very bad, but this is good news for people putting off medical appointments for months.There is more COVID-19 transmission today        than during 58.4% of the pandemic.  CURRENT ESTIMATES FOR February 26, 2024 Wastewater Levels (copies/mL) 546 New Daily Cases 794,000 % of Population Infectious 1.66% (1 in 60 people) New Daily Long COVID Cases 40,000 to 159,000  WEEKLY ESTIMATES FOR February 26, 2024 New Weekly Cases 5,600,000 New Weekly Long COVID Cases 278,000 to 1,112,000  2024 CUMULATIVE ESTIMATES AS OF February 26, 2024 Total 2024 Cases To Date 73,585,610 Total 2024 Long COVID Cases To Date 3,679,000 to 14,717,000
PMC COVID-19 Forecast, Week of Feb 26, 2024
3 of 5 🧵

Risks in Group Settings
Although transmission is falling, it's easy to get distracted by the relative changes and ignore that the absolute risk remains high, especially in large groups with limited or no mitigation.

In a group of 10, there's a 15% at least one person is actively infectious. In a group of 30, it's a 40% chance, and so forth. Almost nobody would take those chances of a serious illness if informed and capable of grappling with the seriousness of that risk without becoming defensive. Unfortunately, a lot of institutions are pushing minimizer narratives if not directly forcing students and workers into more dangerous settings.How Does Risk Increase with More Social Contacts?	 Number of People  |  Chances Anyone is Infectious	 1	1.7% 2	3.3% 3	4.9% 4	6.5% 5	8.0% 6	9.6% 7	11.1% 8	12.5% 9	14.0% 10	15.4% 15	22.2% 20	28.5% 25	34.2% 30	39.5% 35	44.4% 40	48.8% 50	56.7% 75	71.5% 100	81.3% 150	91.9% 200	96.5% 300	99.3% 400	99.9% 500	>99.9%
Read 5 tweets
Feb 8
Dr. Moriarty & other modelers know people are infectious for an average of about 7 days, per high-quality studies. Many for much longer.

Dr. Mina's pinned Tweet lays out a sample timeline.

Sending kids to school on Day 2 positive will essentially maximize infections.
2/4 Pinned tweet from Michael Mina showing a heuristic infection timeline for an individual patient. Sending someone to school 1 day after positive basically means they're being sent to school right at peak infectiousness.
The consequence of the California 1-day isolation policy is that many parents and grandparents will develop serious health conditions and too often die prematurely.

Bad for families. Good for inspiring the next generation of bereavement workers.

3/4
Read 4 tweets
Feb 5
1 / 6 🧵
PMC COVID-19 Forecast, Week of Feb 5, 2024

We are seeing escalating transmission in a post-peak hill.
🔹2.8% (1 in 36) actively infectious
🔹1.3 million infections/day
🔹Hill peaks in 2 days 🤞
🔹>65,000 resulting #LongCOVID cases/dayCURRENT ESTIMATES FOR February 5, 2024 Wastewater Levels (copies/mL) 909 New Daily Cases 1,323,000 % of Population Infectious 2.77% (1 in 36 people) New Daily Long COVID Cases  66,000 to 265,000   4-WEEK FORECAST FOR March 4, 2024 Wastewater Levels (copies/mL) 520 (-43% lower) New Daily Cases 757,000 % of Population Infectious 1.58% (1 in 63 people) New Daily Long COVID Cases  38,000 to 151,000
2 / 6 🧵
PMC COVID-19 Forecast, Week of Feb 5, 2024

We began to see evidence of a post-peak hill 3 weeks ago. I was skeptical. The real-time data now bear this out. Hopefully we are not in a Terminator-style scenario where the technology outsmarts the maker. 🤣Visual shows line graphs for today and each of the past 3 weeks. The post-peak hill becomes more pronounced over time, as the model gains more precision.
3 / 6 🧵
PMC COVID-19 Forecast, Week of Feb 5, 2024

Zooming out to the full pandemic, we see transmission higher than a week ago, and higher than 87.8% of the pandemic.

Nearly 10 million infections/week. >50 million estimated infections so far in 2024 in the U.S. alone.There is more COVID-19 transmission today        than during 87.8% of the pandemic.  CURRENT ESTIMATES FOR February 5, 2024 Wastewater Levels (copies/mL) 909 New Daily Cases 1,323,000 % of Population Infectious 2.77% (1 in 36 people) New Daily Long COVID Cases 66,000 to 265,000  WEEKLY ESTIMATES FOR February 5, 2024 New Weekly Cases 9,300,000 New Weekly Long COVID Cases 463,000 to 1,852,000  2024 CUMULATIVE ESTIMATES AS OF February 5, 2024 Total 2024 Cases To Date 50,401,800 Total 2024 Long COVID Cases To Date 2,520,000 to 10,080,000
Read 6 tweets
Feb 4
The poor drainage infrastructure in #NewOrleans is a detriment to housing justice, quality of life, and productivity.

A thread of videos in and around the area.
🧵
Read 22 tweets
Jan 29
1/
PMC COVID-19 Forecast, Week of Jan 29, 2024

Transmission in the U.S. is extremely high & stable from last week on the back of the 2nd largest surge all-time.

🔹2.5% (1 in 39) actively infectious
🔹1.2 million infections/day
🔹>60,000 resulting daily LC cases
🔹0.8-1.3 million daily infections the next month

Detailed Forecast:
We are in the 2nd largest U.S. surge of the pandemic. Over the next month, we should see 0.8-1.3 million infections per day.

Biobot has made considerable post-hoc corrections to each of the prior 4 weeks of data. This essentially moved the peak earlier, with real-time estimates corrected downward in hindsight the past several weeks, including last week’s numbers getting corrected downward by 3%. The details of the forecasting models can be found in the Technical Notes section in the online report.

Post-Peak Hill? Reviewing the graph of the whole pandemic (Tweet #3), you’ll notice that after about half the waves, instead of a straightforward decline, there is occasionally a temporary deceleration, or even a small hill. Currently, this is what the forecast is showing. It’s unclear whether we will see a very small hill (rebound), a couple weeks with a flat plateau, or just descend at a gradual pace, but it looks like there will continue to be more transmission on the back end of the mountain than the start, as the models have continued to forecast for a long time now.

Good News: The model suggests that around Valentine’s Day (Feb 14), transmission should begin to fall for rapidly. The good news, if any, is that we can begin to discern the “end” of the surge toward late February, when daily infections will likely drop below 1 million nationwide.

Bad News: The bad news is that even the apparent "end" will still have a long ways to go down. For example, note that the starting point of the blue line on the left of the graph is actually the peak of the late-summer wave, which was quite bad.

Technical Note: If you go to the Biobot Dashboard, you'll see levels down 4% from last week, but our model shows levels marginally higher. For Biobot's Jan 27 data point, we enter that as Jan 24 (it's actually the average for the preceding week), assume that data point is a very slight underestimate (pattern the past several weeks), and model that we're already starting to tick up into that little hill. I'd avoid over-interpreting, and just take this to mean transmission is pretty stable at the moment.CURRENT ESTIMATES FOR January 29, 2024 Wastewater Levels (copies/mL) 836 New Daily Cases 1,216,000 % of Population Infectious 2.54% (1 in 39 people) New Daily Long COVID Cases  61,000 to 243,000   4-WEEK FORECAST FOR February 26, 2024 Wastewater Levels (copies/mL) 621 (-26% lower) New Daily Cases 903,000 % of Population Infectious 1.89% (1 in 53 people) New Daily Long COVID Cases  45,000 to 181,000
2/
What's with the Post-Peak Hill?

We're anticipating a post-peak hill. However, I wouldn't be surprised if it's instead a temporary plateau (flat) or simply a deceleration.

The best explanation is that transmission remains high with considerably geographic heterogeneity.

Examples of heterogeneity:
1) Single peak. Many places appear to have a single winter peak this year. In Western Mass, they peaked with 38% of the population actively infectious. Nearly unbelievable. It's hard to imagine a 2nd hill after that. Many other places peaked around 10% actively infectious on the worst day.

2) Late peak: Some places haven't peaked yet. This could account for a post-peak hill.

3) Rebound: Some places had an apparent winter peak but are starting to rebound. The rebound may be marginally higher or lower than the existing apparent "peak." Likely, the earlier peak was lower than in places experiencing a true single peak. They "flattened the curve" a little, but it's a tough fight against in-school transmission.

4) Rollercoaster. More extreme example of the Rebound case. Several peaks and valleys.

5) Flat. Some places have looked pretty flat on transmission for months. Perhaps they are wiser on engineering controls, or perhaps they are approaching a late peak.5 examples of Biobot graphs showing varying patterns of winter transmission. Summarized in Tweet.
3/
Zooming out to the full pandemic:
🔹Stable transmission relative to last week
🔹Transmission remains higher than during 85% of the entire pandemic, i.e., not "over"
🔹We are still in the 2nd-highest wave all-time with >1.2 million U.S. infections/day There is more COVID-19 transmission today        than during 85.7% of the pandemic.  CURRENT ESTIMATES FOR January 29, 2024 Wastewater Levels (copies/mL) 836 New Daily Cases 1,216,000 % of Population Infectious 2.54% (1 in 39 people) New Daily Long COVID Cases 61,000 to 243,000  WEEKLY ESTIMATES FOR January 29, 2024 New Weekly Cases 8,500,000 New Weekly Long COVID Cases 426,000 to 1,702,000  2024 CUMULATIVE ESTIMATES AS OF January 29, 2024 Total 2024 Cases To Date 41,150,380 Total 2024 Long COVID Cases To Date 2,058,000 to 8,230,000
Read 8 tweets

Did Thread Reader help you today?

Support us! We are indie developers!


This site is made by just two indie developers on a laptop doing marketing, support and development! Read more about the story.

Become a Premium Member ($3/month or $30/year) and get exclusive features!

Become Premium

Don't want to be a Premium member but still want to support us?

Make a small donation by buying us coffee ($5) or help with server cost ($10)

Donate via Paypal

Or Donate anonymously using crypto!

Ethereum

0xfe58350B80634f60Fa6Dc149a72b4DFbc17D341E copy

Bitcoin

3ATGMxNzCUFzxpMCHL5sWSt4DVtS8UqXpi copy

Thank you for your support!

Follow Us!

:(