Recognizing trends in the market must be so simple. Impossible to screw this up, right? Well, it couldn't be further from the truth. It's very difficult as the trends are fractals - they are self-complex. Recognizing them is a skill. Here's something I got to aid. Hope it helps🧡 

Speaking of trends, let's not forget about volatility. It can be measured in different ways as it corresponds with the probability or money in danger. Indicators such as ATR help control the risk to avoid devastating losses. The FOMC meeting may liquidate many traders tomorrow...

... And to avoid the devastating losses and liquidations tomorrow, you'd need a concise trading system. A well-composed system defines the markets, entries, exits, stop-losses, tactics, and position sizing. Having those in place can save you from extreme ruin. Use this for help!

Then, in money management, it's essential to adjust for the risk. More volatile assets need a smaller position size, as the odds of losing money are greater, most of the time. The popular 2% risk rule really works. Learn more, unlock 24/7 trading help now👉bit.ly/3oyspPi

In trading, it is always about the disparity between the traders' imagined expectations and the reality. The bigger the disparity, the greater the price shock result.
https://twitter.com/crypto_birb/status/1551903140718542849
Finally, find more $BTC insights in my free report (read here: bit.ly/3b2AMj0)
https://twitter.com/crypto_birb/status/1551648126917873665
What many traders forget is they trade their precious time for profits, or more often - losses. The opportunity cost for endless hours spent at charts (leads to analysis paralysis anyway) is huge. You can't make it back. Save your time wisely with scanner: bit.ly/3PI60uX


@BC_Richfield @KingJulianIAm @MilkyGemHunter @TheBirbNest @TheTradingTank @crypto_madmax @pedma7 @sister_birb Interestingly, there will rarely be only one answer to what kinds of trends you are looking at. The fractal nature makes it possible for an asset price trend to be bullish, bearish, and neutral at the same time. For it, define the trend category: primary, secondary, and tertiary.

Want more free insights on how to avoid big losses today? Join me LIVE in 15min with link below🚨
https://twitter.com/crypto_birb/status/1552310029763710980?s=20&t=6_BlWpr-dTgtCJti-pweHg
Pick your side and mark the vote: $BTC will go
tradingview.com/x/ecVOwmnd/
tradingview.com/x/ecVOwmnd/
Catch this glossary. Might be helpful this week

The RRG is an extremely valuable tool I use. It visualizes the processes behind the sector rotation. Based on the relative strength, and relative momentum of certain stock sectors against the S&P 500, it reveals portfolio management tips.
Learn more free👉bit.ly/3viPkSH
Learn more free👉bit.ly/3viPkSH


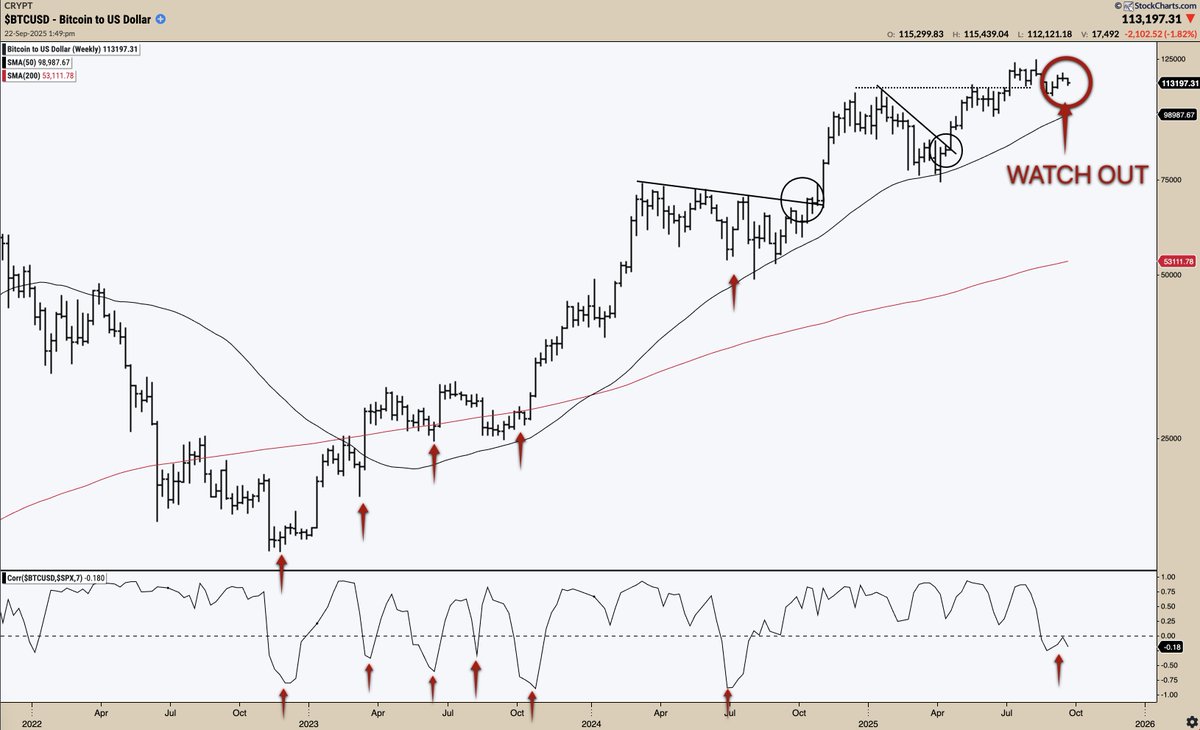
@BC_Richfield @KingJulianIAm @MilkyGemHunter @TheBirbNest @TheTradingTank @crypto_madmax @pedma7 @sister_birb URGENT! Now, that $BTC has confirmed the CTF breakout (huge rally potential), you must watch out for #recession dangers ahead! As a trader, you need a strong discipline and a profitable system. If need to learn how to avoid huge losses fast, discover this: bit.ly/3zerJ6I

• • •
Missing some Tweet in this thread? You can try to
force a refresh