
Detailed Study of Stocks that became 5X in past 2 Years
A Mega Thread🧵
Concepts :
Relative Strength
Stage Analysis
Retweet and Comment If you want a PDF
A Mega Thread🧵
Concepts :
Relative Strength
Stage Analysis
Retweet and Comment If you want a PDF
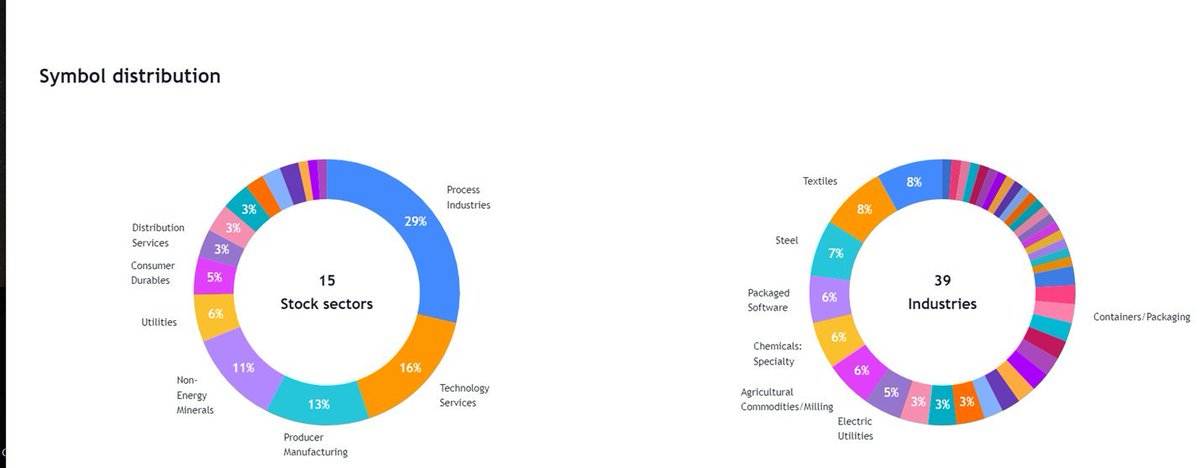
We have Got around 86 Stocks that became 5X in 2 years
These Belonged to various sectors and Groups
Excel Link for List of Stocks
docs.google.com/document/d/1J-…
( As on 30th March 2022)
[1/n]
These Belonged to various sectors and Groups
Excel Link for List of Stocks
docs.google.com/document/d/1J-…
( As on 30th March 2022)
[1/n]
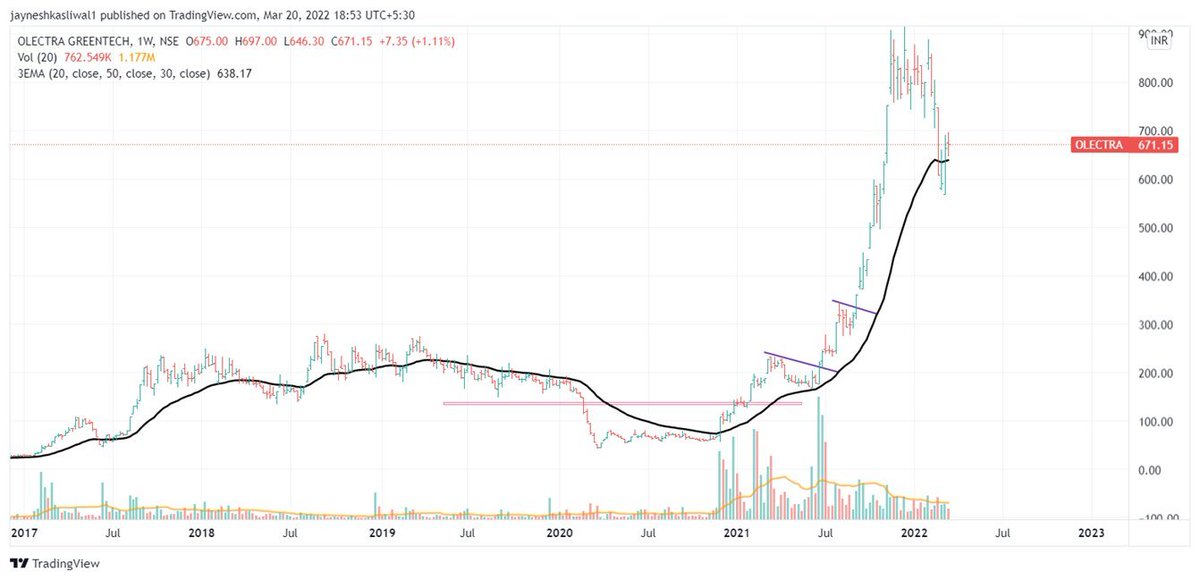
All stocks had few things in common :
Stocks doubled Before entering into Stage 2 Uptrend
52 week RS was positive in stage 2
90% stocks even gave all time high breakout after Stage 2
60 Stocks had market cap less than 1000 Cr
Examples : OLECTRA , PGEL
[2/n]
Stocks doubled Before entering into Stage 2 Uptrend
52 week RS was positive in stage 2
90% stocks even gave all time high breakout after Stage 2
60 Stocks had market cap less than 1000 Cr
Examples : OLECTRA , PGEL
[2/n]

So What is Relative Strength ?
Relative strength is a strategy used in momentum investing and in identifying value stocks.
It focuses on investing in stocks or other investments that have performed well relative to the market as a whole or to a relevant benchmark.
[3/n]
Relative strength is a strategy used in momentum investing and in identifying value stocks.
It focuses on investing in stocks or other investments that have performed well relative to the market as a whole or to a relevant benchmark.
[3/n]
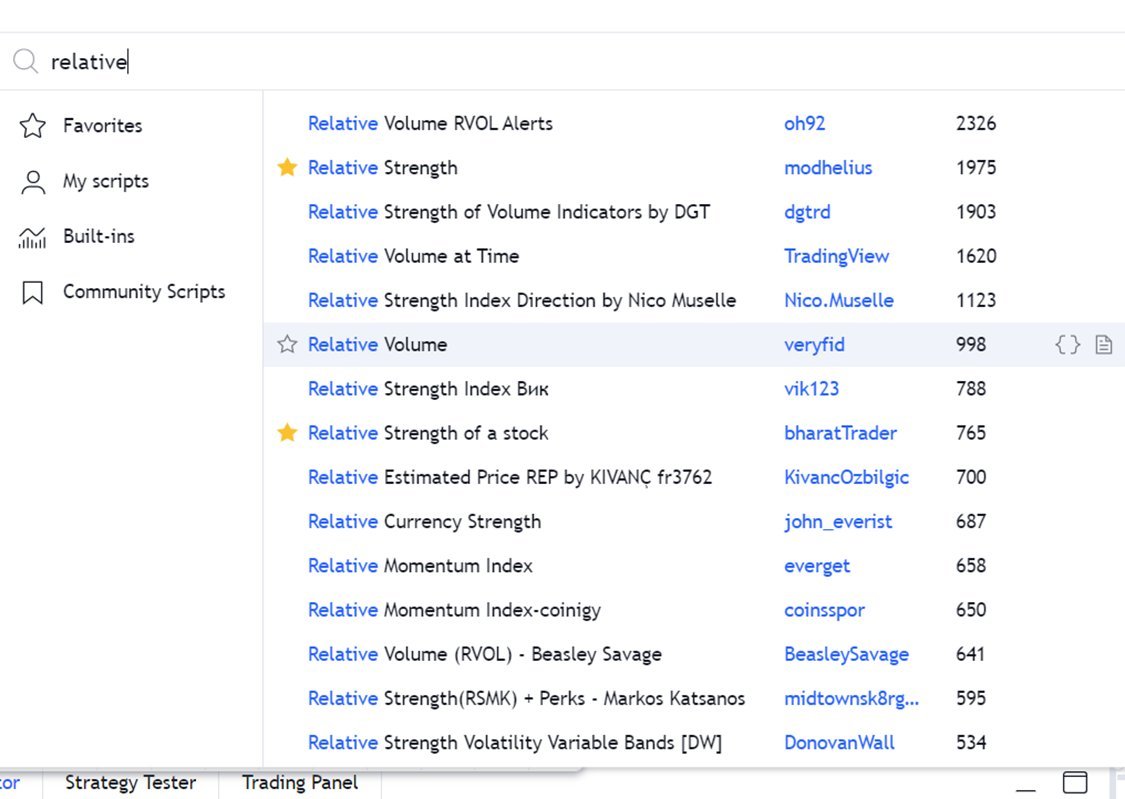
How to Apply ?
Type
“Relative Strength”
Choose any
By bharattrader
By traderlion
By Modhelius
I use by bharattrader
In setting use 52 period
Use Weekly Chart
4/n
Type
“Relative Strength”
Choose any
By bharattrader
By traderlion
By Modhelius
I use by bharattrader
In setting use 52 period
Use Weekly Chart
4/n
Helps to filter out stocks in good momentum and that are giving better returns than nifty
These stocks tend to outperform the market for a long term
These are potentially superstocks
52 period signifies 1 Year of trading
In 1 Year we have around 52 trading Weeks
5/n
These stocks tend to outperform the market for a long term
These are potentially superstocks
52 period signifies 1 Year of trading
In 1 Year we have around 52 trading Weeks
5/n


What is Stage Analysis ?
Stage 1 : Accumulation Phase
Stage 2: Advancing Phase This is the stage where we should be looking to take long positions in a stock or index. Buyers are now in control and the balance of power is now in line with demand
Look for Stocks in Stage 2
6/n
Stage 1 : Accumulation Phase
Stage 2: Advancing Phase This is the stage where we should be looking to take long positions in a stock or index. Buyers are now in control and the balance of power is now in line with demand
Look for Stocks in Stage 2
6/n


Past Leaders Charts :
3 types of entries
Stage 1 Breakout
52 week high Breakout
All time / Multi Year Breakout
[7/n]
#LTI #JSLHISAR #Tatalexsi
3 types of entries
Stage 1 Breakout
52 week high Breakout
All time / Multi Year Breakout
[7/n]
#LTI #JSLHISAR #Tatalexsi


Trading Strategy to find new Leaders :
Let us now summarize everything and apply the whole concept in real trading
What are we looking for ?
Stock breaking out of stage 1 and above 30 wema
Relative strength > 0 and increasing
Example : #MRPL , #SDBL , #MARATHON
[8/n]
Let us now summarize everything and apply the whole concept in real trading
What are we looking for ?
Stock breaking out of stage 1 and above 30 wema
Relative strength > 0 and increasing
Example : #MRPL , #SDBL , #MARATHON
[8/n]

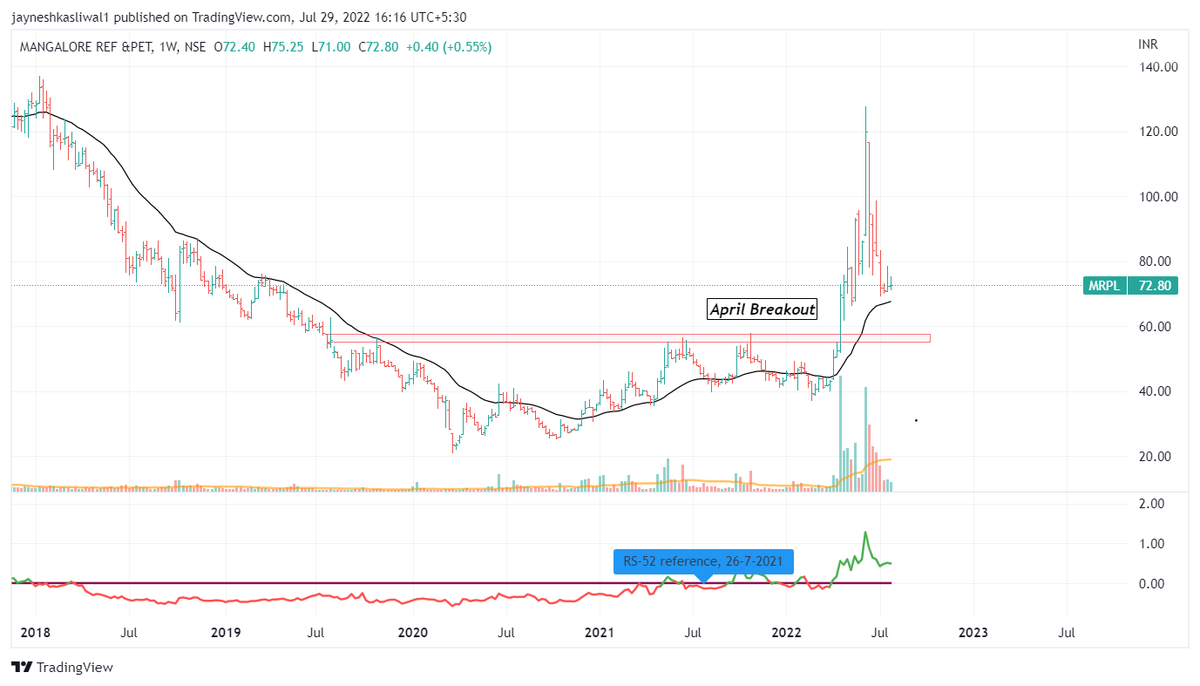

The more time RS was positive before the breakout the better .
Enter on Stage 1 Breakout
Look for rising Volumes on right side of base
Volume on Updays should be greater than Volume on Downdays
[9/n]
Enter on Stage 1 Breakout
Look for rising Volumes on right side of base
Volume on Updays should be greater than Volume on Downdays
[9/n]

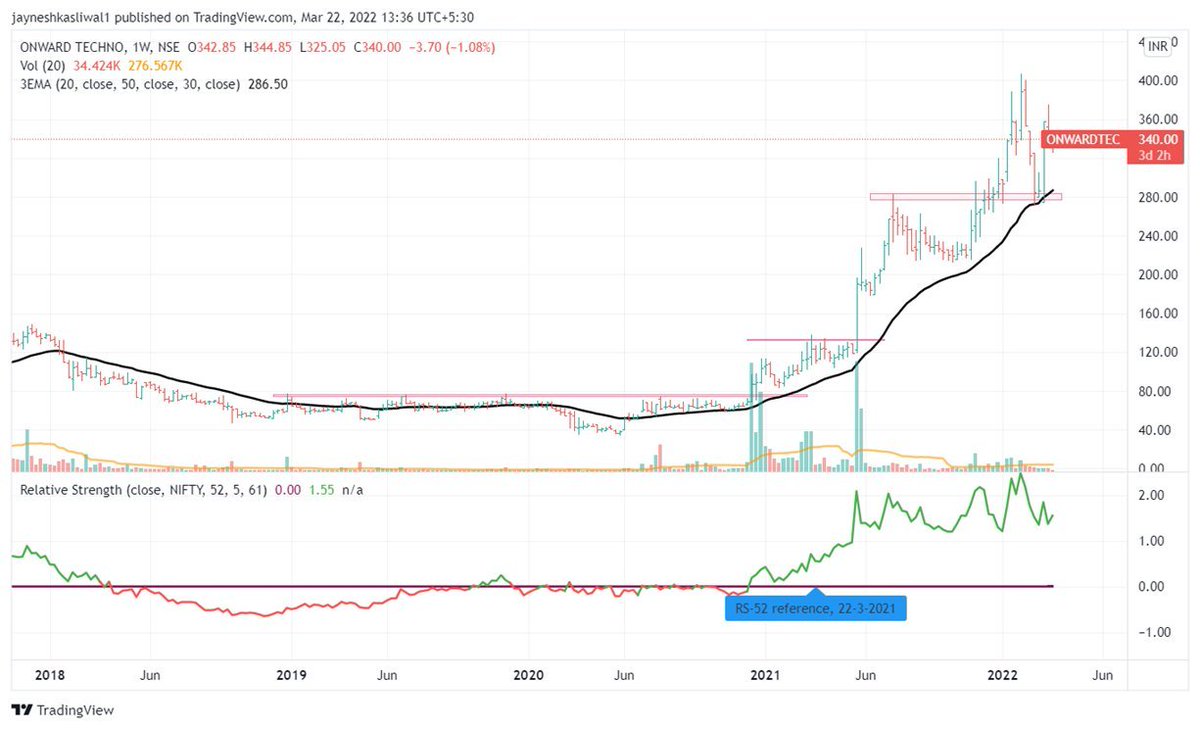
Observations of Past data
✴️Only ¼ of the stocks were trading above 100 before they became 5X
✴️Out of 85 Stocks only 20 were above 100 rs
✴️Even now 50 Stocks are having market Cap less than 5000 Cr that means they were having market cap of around 1k cr before they become 5X
10
✴️Only ¼ of the stocks were trading above 100 before they became 5X
✴️Out of 85 Stocks only 20 were above 100 rs
✴️Even now 50 Stocks are having market Cap less than 5000 Cr that means they were having market cap of around 1k cr before they become 5X
10
20 Stocks are having market cap above 20k cr now
66 Stocks have market cap 10k Cr now !
Only 11 Stocks had ROE and ROCE >20 That means Fundamentals didn’t matter that much
#CentruyPly #Onwardtech
Stage 2 Screener Video :
[11/n]
66 Stocks have market cap 10k Cr now !
Only 11 Stocks had ROE and ROCE >20 That means Fundamentals didn’t matter that much
#CentruyPly #Onwardtech
Stage 2 Screener Video :
[11/n]

Stoploss Also Hits using The same Stratgey
#CosmoFilms
#PrakashIndustry
Risk Reward Will always be > 1:10 As if we ride the complete trend till stage 3 Breakdown then stocks become 2X 3X easily
Small Losses should be Booked and Re entry should be Taken if stock regains momentum
#CosmoFilms
#PrakashIndustry
Risk Reward Will always be > 1:10 As if we ride the complete trend till stage 3 Breakdown then stocks become 2X 3X easily
Small Losses should be Booked and Re entry should be Taken if stock regains momentum


Some Stocks That are coming out of stage 1 and 52 week RS Increasing and >0
#Shankara #HSCl #RuchiraPapers
#SDBL
Using the Same Concepts of Stage Analysis and Relative Strength
𝘋𝘦𝘵𝘢𝘪𝘭𝘦𝘥 𝘠𝘰𝘶𝘵𝘶𝘣𝘦 𝘝𝘪𝘥𝘦𝘰 (𝗗𝗼𝗻𝘁 𝗠𝗶𝘀𝘀 !)
[13/n]
#Shankara #HSCl #RuchiraPapers
#SDBL
Using the Same Concepts of Stage Analysis and Relative Strength
𝘋𝘦𝘵𝘢𝘪𝘭𝘦𝘥 𝘠𝘰𝘶𝘵𝘶𝘣𝘦 𝘝𝘪𝘥𝘦𝘰 (𝗗𝗼𝗻𝘁 𝗠𝗶𝘀𝘀 !)
[13/n]
RULES :
➡️Enter Near Stage 1 Breakout and Pyramid Slowly
➡️Use 30 Wema trailing Stoploss
➡️ Look for Stocks below 1000 cr Market cap
➡️Fundamentals dont matter much if you use stoploss
[14/n]
➡️Enter Near Stage 1 Breakout and Pyramid Slowly
➡️Use 30 Wema trailing Stoploss
➡️ Look for Stocks below 1000 cr Market cap
➡️Fundamentals dont matter much if you use stoploss
[14/n]
MentorShip Program:
SWING TRADING MENTORSHIP GROUP!
✅Mentorship starting from 7th August on weekends only with recording (5 Sessions)
✅Covering Pure Price Action , Relative Strength, Stage Analysis, How to find Super Stocks
LINK FOR ENQUIRY:
wa.link/si4jn4
[15/n]
SWING TRADING MENTORSHIP GROUP!
✅Mentorship starting from 7th August on weekends only with recording (5 Sessions)
✅Covering Pure Price Action , Relative Strength, Stage Analysis, How to find Super Stocks
LINK FOR ENQUIRY:
wa.link/si4jn4
[15/n]

Use the link for payment
rigipay.com/g/Bmtu24p9sD
(You will be added to Whatsapp Directly)
Telegram Link : t.me/Techno_Charts
rigipay.com/g/Bmtu24p9sD
(You will be added to Whatsapp Directly)
Telegram Link : t.me/Techno_Charts
If you are interested in Option Selling Watch this Video :
𝗦𝘄𝗶𝗻𝗴 𝗧𝗿𝗮𝗱𝗶𝗻𝗴 𝗠𝗲𝗻𝘁𝗼𝗿𝘀𝗵𝗶𝗽 to find winning Stocks Starting from August
𝘍𝘦𝘦𝘥𝘣𝘢𝘤𝘬 from Last Few Batches :
Payment Link : rigipay.com/g/Bmtu24p9sD
//END//
𝘍𝘦𝘦𝘥𝘣𝘢𝘤𝘬 from Last Few Batches :
Payment Link : rigipay.com/g/Bmtu24p9sD
//END//


• • •
Missing some Tweet in this thread? You can try to
force a refresh


