
Trading Strategies is something which gives an edge to a #Traders.
A Complete #Thread on How to Backtest your Trading Strategies and check whether strategy is good or not?
Like and Retweet so that it helps max people.
A Complete #Thread on How to Backtest your Trading Strategies and check whether strategy is good or not?
Like and Retweet so that it helps max people.
For every strategy, there needs to be a hypothesis whether that particular strategy had worked in the past or not.
So you can create a proper rule based strategy like Moving Average Crossover or even discretion based strategy like Price Action.
So you can create a proper rule based strategy like Moving Average Crossover or even discretion based strategy like Price Action.
Now once you create a strategy, it needs to be backtested on historical data.
It's important to do a complete backtest for atleast 5 years, which might include a complete market cycle.
Higher the backtesting duration, the more accurate will be the result.
It's important to do a complete backtest for atleast 5 years, which might include a complete market cycle.
Higher the backtesting duration, the more accurate will be the result.
So there are various modes of backtesting: Manual Checking or coding.
Rule-Based strategies can be coded and backtested on Pinescript in @tradingview if you have coding knowledge. This will save a lot of time.
Manual backtest can take time, but it will be more accurate.
Rule-Based strategies can be coded and backtested on Pinescript in @tradingview if you have coding knowledge. This will save a lot of time.
Manual backtest can take time, but it will be more accurate.
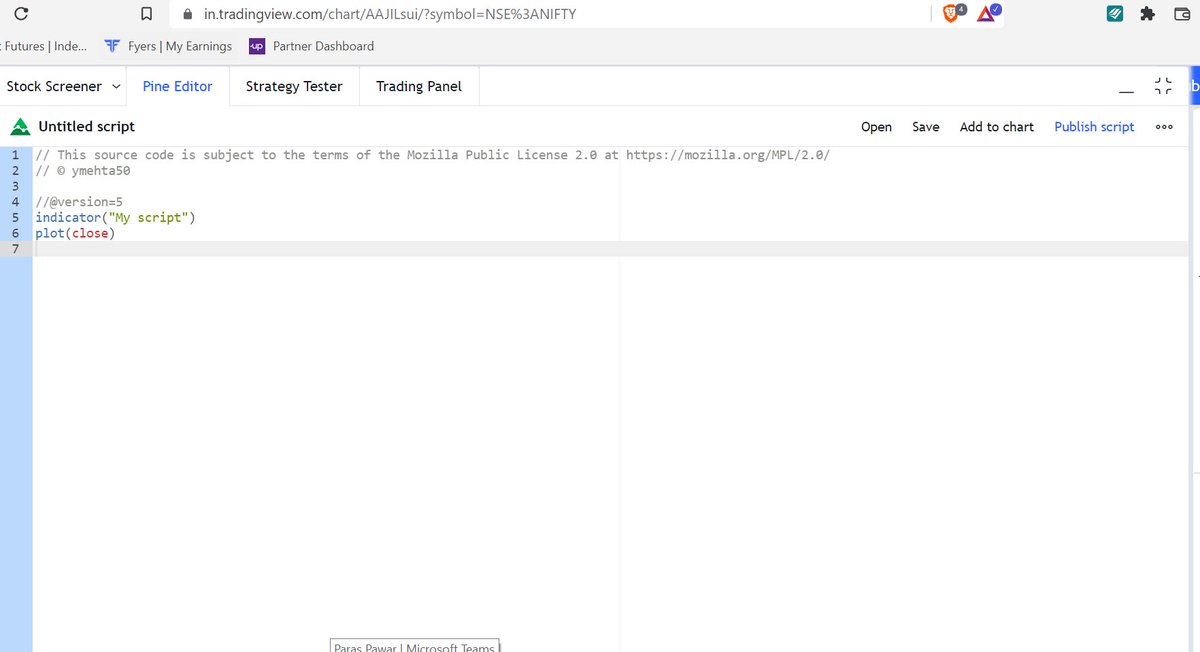
You can check out TradingView manual on Pinescript:
tradingview.com/pine-script-do…
Also, there are a couple of courses and free videos available on YouTube that you can check.
tradingview.com/pine-script-do…
Also, there are a couple of courses and free videos available on YouTube that you can check.
Also, in backtesting, you can add slippage, which generally happens in trading, and also add the trading cost: Brokerage, STT, etc.
Trading cost you can find on your broker's brokerage calculator and just subtract the Gross P/L of that trade with the Trading Cost.
Trading cost you can find on your broker's brokerage calculator and just subtract the Gross P/L of that trade with the Trading Cost.
Now, after all this, you will get all the required data to compute the final backtesting trading report.
There are two things to look into this: Trading Statistics and Historical Equity Curve.
There are two things to look into this: Trading Statistics and Historical Equity Curve.
In Trading Statistics, take out the following data:
No. of Trades
No. of Profitable Trades
No. of Loss Trades
Average Profit
Average Loss
Drawdown
All this data is shown in the sample trade stats report below.
No. of Trades
No. of Profitable Trades
No. of Loss Trades
Average Profit
Average Loss
Drawdown
All this data is shown in the sample trade stats report below.
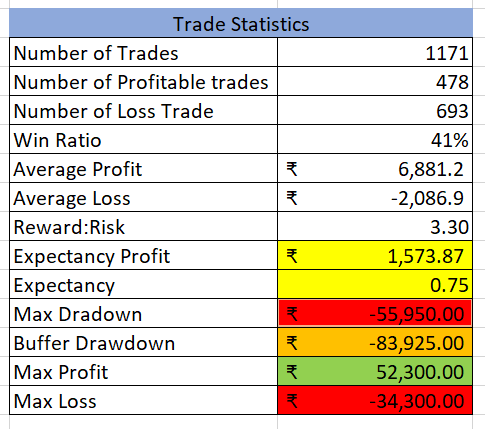
With the above report, calculate the following things:
Win Ratio (A) = No. of Profitable Trades/No. of Loss Trades
Reward:Risk (R:R) = Average Profit/Average Loss
Expectancy Ratio = A * (R:R) - (1-A)
Expectancy in Value = A * Average Profit - (1-A)* Average Loss.
Win Ratio (A) = No. of Profitable Trades/No. of Loss Trades
Reward:Risk (R:R) = Average Profit/Average Loss
Expectancy Ratio = A * (R:R) - (1-A)
Expectancy in Value = A * Average Profit - (1-A)* Average Loss.
Expectancy in Value means that how much money are you expected to win for each trade that you take in future.
Expectancy Ratio if positive and above 0.4 that means strategy is good.
Expectancy Ratio if positive and above 0.4 that means strategy is good.
Now, we have taken Max Drawdown in the backtest.
Whenever you trade this strategy, that much is the minimum drawdown that you can expect in the future.
Always add buffer to this drawdown, in the case of the above image, 50% buffer is added above drawdown, which can be expected.
Whenever you trade this strategy, that much is the minimum drawdown that you can expect in the future.
Always add buffer to this drawdown, in the case of the above image, 50% buffer is added above drawdown, which can be expected.
Now coming to the Equity Curve and Calculating Returns.
You will have to take a trading capital that will be used to trade this strategy.
Add all the net profit and loss of all the trade to this capital.
At the end of the bactesting, you will get a final capital value.
You will have to take a trading capital that will be used to trade this strategy.
Add all the net profit and loss of all the trade to this capital.
At the end of the bactesting, you will get a final capital value.
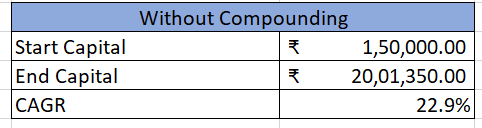
With this, you can calculate total returns in percentage terms and also the CAGR.
Total Returns = (Final Capital/Starting Capital -1)*100%
CAGR = ((Final Capital/Starting Capital)^(1/Duration) - 1) *100%
Total Returns = (Final Capital/Starting Capital -1)*100%
CAGR = ((Final Capital/Starting Capital)^(1/Duration) - 1) *100%
If you have created a strategy for trading, then compare this CAGR with the Nifty/Sensex CAGR over the same duration.
If your CAGR is more than the benchmark, then it is a green signal to use this strategy in the future.
If your CAGR is more than the benchmark, then it is a green signal to use this strategy in the future.
Also, you can add a compounding effect in this strategy, like increasing quantities as your profits and capital grow.
Other wise investing in the benchmark will give you better returns than the strategy. And it would be a waste of your time to use this strategy.
After you both the trade statistics report and Equity Curve report are satisfactory, then go ahead with the strategy and use it.
After you both the trade statistics report and Equity Curve report are satisfactory, then go ahead with the strategy and use it.
Now that's all about backtesting.
Once you start trading it live or do forward testing, then always start with small capital and test it for 6-12 months. Don't pump in big capital because backtest doesn't prepare you emotionally and that will happen over a period.
Once you start trading it live or do forward testing, then always start with small capital and test it for 6-12 months. Don't pump in big capital because backtest doesn't prepare you emotionally and that will happen over a period.
That was all about the Backtesting and checking how good the strategy is.
I hope you found this thread helpful.
For more such learning #threads, Follow @YMehta_
Like/Retweet the first tweet below if you can:
I hope you found this thread helpful.
For more such learning #threads, Follow @YMehta_
Like/Retweet the first tweet below if you can:
https://twitter.com/YMehta_/status/1553263022101393408
• • •
Missing some Tweet in this thread? You can try to
force a refresh


