πŸ”₯ Matt Dancho (Business Science) πŸ”₯ Profile picture
Jul 30, 2022 β€’ 10 tweets β€’ 5 min read β€’ Read on X
How my life is changing as a direct result of attending the #RStudioConf 🧡

#rstats
Just 3 days ago, I had the pleasure of watching the #rstudioconf2022 kick off.

I've been attending since 2018 and watching even longer than that.

And, I was just a normal spectator in the audience until this happened.
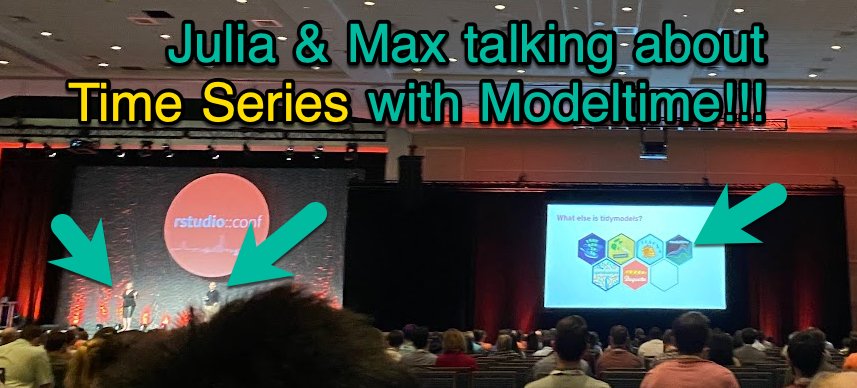
@topepos and @juliasilge's keynote showed all of the open source work their team has been working on to build the best machine learning ecosystem in R called #tidymodels.

And then they brought this slide up.
Max and Julia then proceeded to talk about how the community members have been working on expanding the ecosystem.

- Text Recipes for Text
- Censored for Survival Modeling
- Stacks for Ensembles

And then they announced me and my work on Modeltime for Time Series!!!
I had no clue this was going to happen.

Just a spectator in the back.

My friends to both sides went nuts. Hugs, high-fives, and all.

My students in my slack channel went even more nuts.
Throughout the rest of the week, I was on cloud-9.

My students that were at the conf introduced themselves.

Much of our discussions centered around Max & Julia's keynote and the exposure that modeltime got.
And all of this wouldn't be possible without the support of this company. Rstudio / posit.

So, I'm honored to be part of something bigger than just a programming language.

And if you'd like to learn more about what I do, I'll share a few links.
The first is my modeltime package for #timeseries.

This has been a 2-year+ passion project for building the premier time series forecasting system.

It now has multiple extensions including ensembles, resampling, deep learning, and more.

business-science.github.io/modeltime/
The second is my company @bizScienc.

For the past 4-years I've dedicated myself to teaching students how to apply data science to business.

I have 3000+ students worldwide.

Here are some of my tribe that I met at #rstudioconf2022.
The third is my 40-minute webinar.

I put a free presentation together to help you on your journey to become a data scientist.

A few things I talk about:

Modeltime for Time Series.
Tidymodels & H2O for Machine Learning
Shiny for Web Apps
and 7 more!

learn.business-science.io/free-rtrack-ma…

β€’ β€’ β€’

Missing some Tweet in this thread? You can try to force a refresh
γ€€

Keep Current with πŸ”₯ Matt Dancho (Business Science) πŸ”₯

πŸ”₯ Matt Dancho (Business Science) πŸ”₯ Profile picture

Stay in touch and get notified when new unrolls are available from this author!

Read all threads

This Thread may be Removed Anytime!

PDF

Twitter may remove this content at anytime! Save it as PDF for later use!

Try unrolling a thread yourself!

how to unroll video
  1. Follow @ThreadReaderApp to mention us!

  2. From a Twitter thread mention us with a keyword "unroll"
@threadreaderapp unroll

Practice here first or read more on our help page!

More from @mdancho84

Jul 20
Forecasting time series is what made me stand out as a data scientist.

But it took me 1 year to master ARIMA.

In 1 minute, I'll teach you what took me 1 year.

Let's go. 🧡 Image
1. ARIMA and SARIMA are both statistical models used for forecasting time series data, where the goal is to predict future points in the series.
2. Business Uses: I got my start with ARIMA using it for sales demand forecasting. But ARIMA and forecasting are also used heavily in econometrics, finance, retail, energy demand, and any situation where you need to know the future based on historical time series data.
Read 12 tweets
Jul 20
Why should you learn Polars in Python?

This is why. 🧡

#python Image
Polars is a fast and efficient DataFrame library designed for data analysis and manipulation in Rust and Python.

It is built to provide high-performance data processing capabilities, often outperforming traditional libraries like pandas, especially with large datasets.
1. Performance: Polars is designed with performance in mind, leveraging Rust's speed and safety to handle large datasets efficiently.
Read 8 tweets
Jul 18
Bayes' Theorem is a fundamental concept in data science.

But it took me 2 years to understand its importance.

In 2 minutes, I'll share my best findings over the last 2 years exploring Bayesian Statistics.

Let's go. 🧡 Image
1. Background:

"An Essay towards solving a Problem in the Doctrine of Chances," was published in 1763, two years after Bayes' death.

In this essay, Bayes addressed the problem of inverse probability, which is the basis of what is now known as Bayesian probability.
2. Bayes' Theorem:

Bayes' Theorem provides a mathematical formula to update the probability for a hypothesis as more evidence or information becomes available.

It describes how to revise existing predictions or theories in light of new evidence, a process known as Bayesian inference.
Read 8 tweets
Jul 5
XGBoost is now the go-to number 1 must-have algorithm in my data science toolkit.

But for years, I had no clue what I was doing. In 3 minutes, I’ll share 3 months of research (business case included).

Let’s go: 🧡 Image
1. XGBoost, which stands for Extreme Gradient Boosting, is an advanced implementation of the gradient boosting machine (GBM) algorithm. It was developed to optimize both computational speed and model performance.
2. Gradient Boosting Machine (GBM): GBMs are an ensemble approach that combines multiple weak learners (typically decision trees) to create a strong predictive model.
Read 9 tweets
Jul 3
I completed my first Python Sales Forecasting Project using Nixtla's StatsForecast and a NEW IDE for Data Scientists.

Here's how I want to help you do it too: 🧡

#python #rstats Image
Sales forecasting is a struggle for many data scientists.

Most college DS programs don't teach it (or gloss over it).

But it's one of the most important skills that companies need.

There are 2 incredible tools out there that I want to share with you:
1. Nixtla's StatsForecast

I love this library for classic econometric models like ARIMA, ETS (Exponential Smoothing), GARCH, and AutoARIMA.

It's super easy to automate forecasting.

And it's got awesome plotting functions, conformal intervals, and more.
Read 5 tweets
Jun 29
Bayes' Theorem is a fundamental concept in data science.

But it took me 2 years to understand its importance.

In 2 minutes, I'll share my best findings over the last 2 years exploring Bayesian Statistics.

Let's go. Image
1. Background: "An Essay towards solving a Problem in the Doctrine of Chances," was published in 1763, two years after Bayes' death. In this essay, Bayes addressed the problem of inverse probability, which is the basis of what is now known as Bayesian probability.
2. Bayes' Theorem: Bayes' Theorem provides a mathematical formula to update the probability for a hypothesis as more evidence or information becomes available. It describes how to revise existing predictions in light of new evidence, a process known as Bayesian inference.
Read 9 tweets

Did Thread Reader help you today?

Support us! We are indie developers!


This site is made by just two indie developers on a laptop doing marketing, support and development! Read more about the story.

Become a Premium Member ($3/month or $30/year) and get exclusive features!

Become Premium

Don't want to be a Premium member but still want to support us?

Make a small donation by buying us coffee ($5) or help with server cost ($10)

Donate via Paypal

Or Donate anonymously using crypto!

Ethereum

0xfe58350B80634f60Fa6Dc149a72b4DFbc17D341E copy

Bitcoin

3ATGMxNzCUFzxpMCHL5sWSt4DVtS8UqXpi copy

Thank you for your support!

Follow Us!

:(