
1) In this video, IMF touched on two topics. Inflation and expected slowdown in global growth. In our view, the presentation is missing on key factors that we will cover in below critique.
https://twitter.com/IMFNews/status/1555537857040814081
2) Inflation: According to IMF Rising Energy and Food Prices along with supply chain disruptions is causing inflation. However, they missed the other and more important factors of record high fiscal deficit and record volume of currency in circulation.
3) The graph below shows parabolic increase in M1 money supply since COVID hit. Money supply has increased nearly five folds since. 

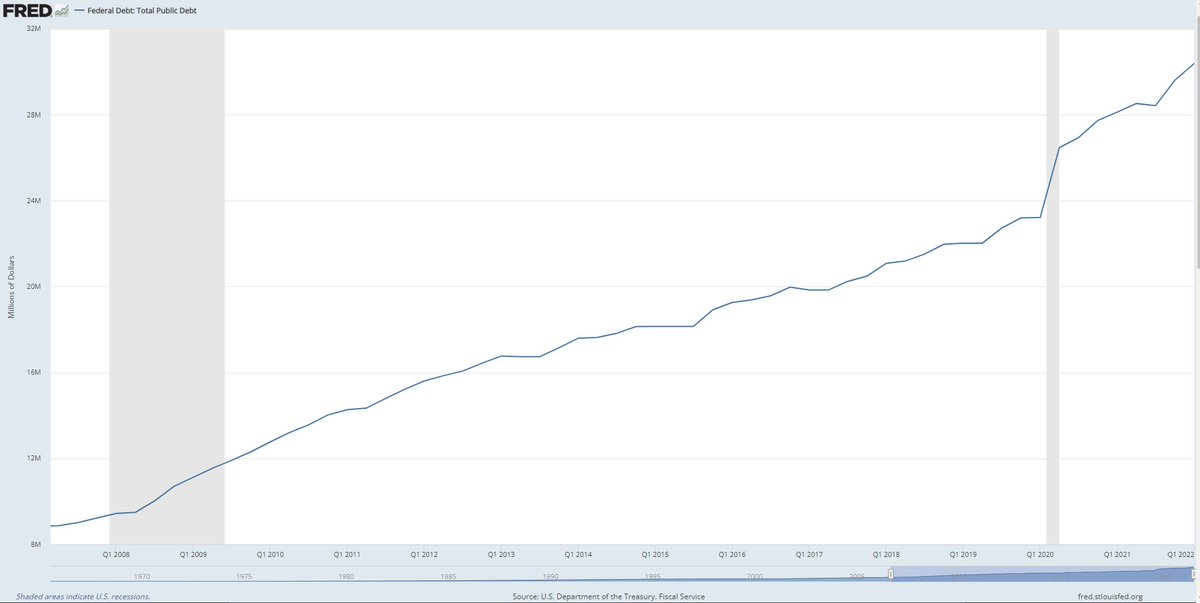
4) Loose monetary policy has been coupled with record fiscal deficits leading to increased government debt. The government debt has increased by 30% since COVID, adding to inflationary pressures. US debt now sits at 30 trillion.
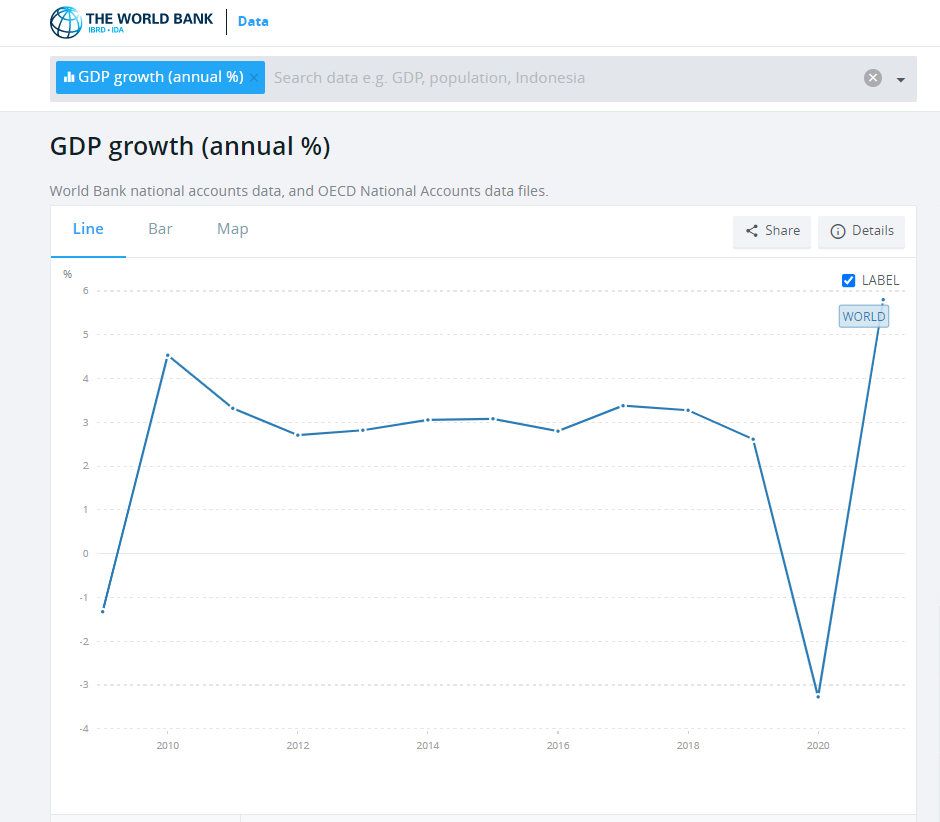
5) Next, IMF mentions that global growth is slowing. It is to be noted that global growth is anemic since 2008 when global financial crisis hit. Global growth rate in 2019 was 2.6 % and has averaged 3% since 2008. IMF expects 2023 growth of 2.9% which is higher than pre-pandemic.
6) So how is this different from what was ongoing since 2008?
7) At last they compare GDP growth rate for 2021, 2022 and 2023 to show a decline of GDP trend. Using 2021 GDP growth data is a bit misleading as it uses 2020 as base year. 2020 GDP numbers were low due to COVID lockdowns, giving the impression that 2021 was a high growth year
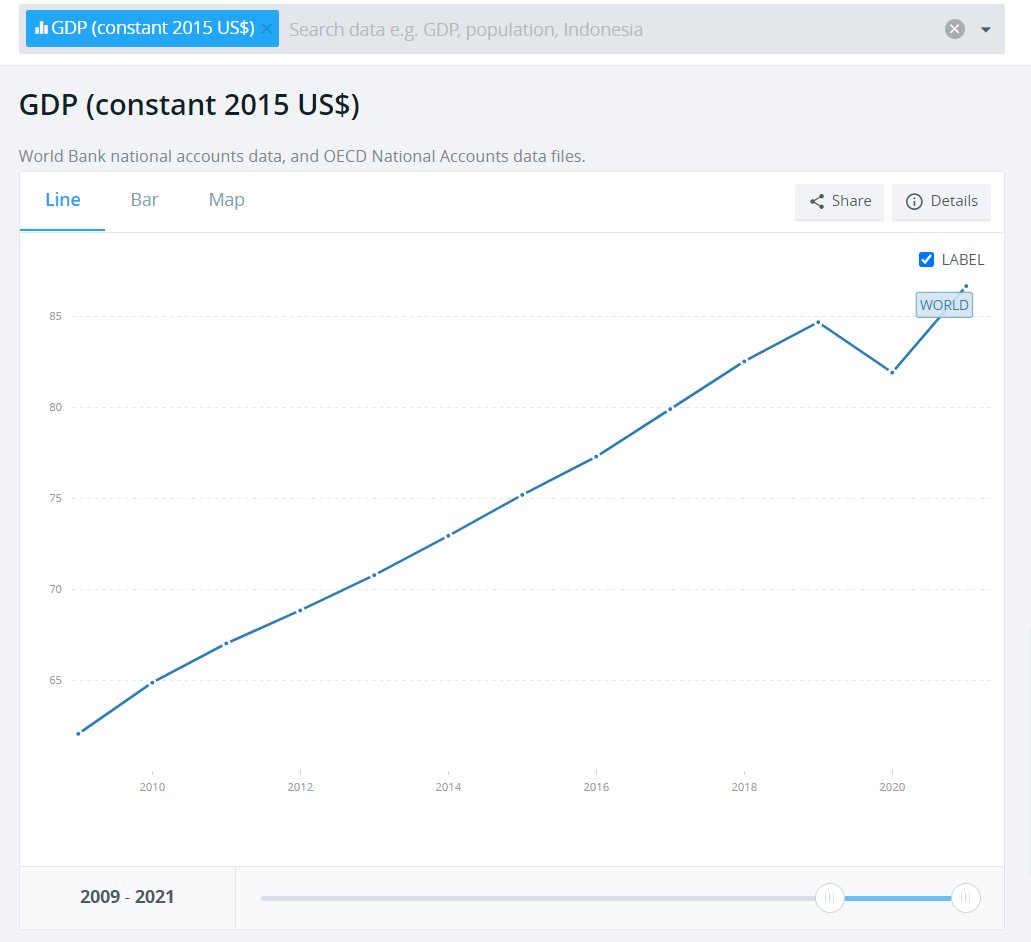
8) However, 2021 GDP numbers were higher than 2019 by only couple percent. So absent COVID pandemic, the world was slowing down. The record amount of government debt and loose monetary policy is exacerbating the situation.
9) #RussiaUkraineWar and supply chain disruptions are factors. However, fiscal and monetary policy are a dominant forces driving current economic conditions.
• • •
Missing some Tweet in this thread? You can try to
force a refresh


