Scott Irwin Profile picture
Aug 9 10 tweets 3 min read
1. Recommended Reading for the Day: This really is a "wow" article. In 10 minutes or reading you can learn alot here about organic vs. conventional farming returns. Thanks Mike Langemeier! #boilerup
2. An awfully lot of opinion out there about organic vs. conventional crop returns. Mike has assembled invaluable comparisons from the same FINBIN database. Here are five-year average yields. Hits to organic yields are obvious and big for corn and soybeans.
3. Now lets turn to gross revenue per unit, or price. Some eye-popping organic premiums here across the board. Remember these are not theoretical. Based on actual farm return data. Organic corn premium was almost $5 per bushel!
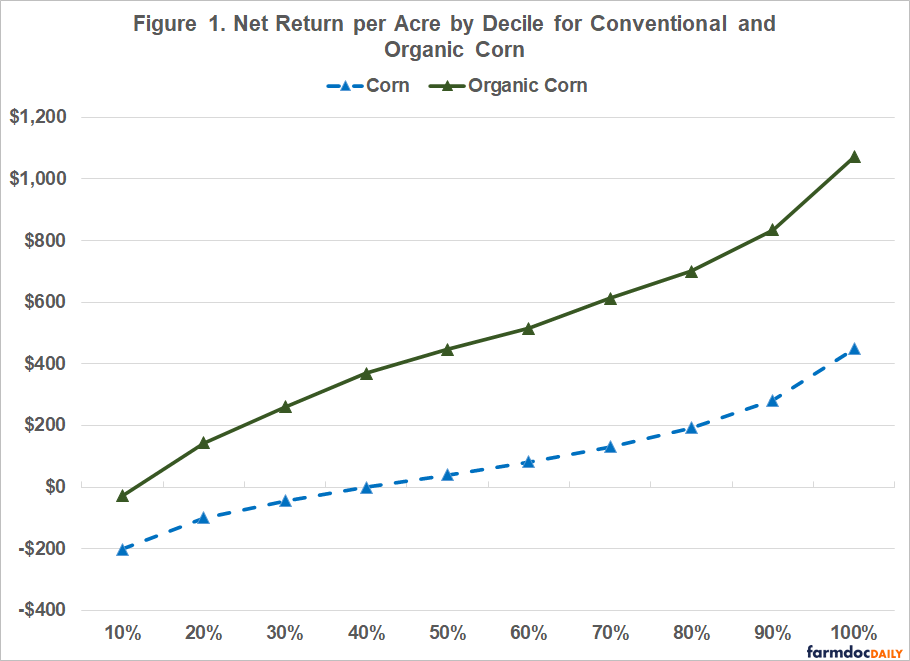
4. So now, what wins out in organic vs. conventional: lower yields or higher prices? What about costs? Here are the net returns per acre by decile of returns for conventional vs. organic. At least in this data, organic appears to win hands down.
5. So which is it, organic or conventional? Which has the higher returns? Alas, we still do not completely know the answer even with this great analysis. First, organic rotations are more complex than 50/50 rotations. Have to include small grains, cover crops, etc.
6. Second, for full analysis you have to account for the cost of transitioning from conventional to organic. This is very much not inconsequential. Still, I was impressed with the price premiums for organic and increase in organic enterprise returns for most crops.
7. Not lets talk some simple economics on conventional vs. organic crop returns. The article indicates that only 2% of US cropland is organic. Even if growing that is a tiny slice of the pie. Economics suggests that the reason is that costs of switching to organic are high.
8. If organics were just straight up much more profitable than conventional crops there would be a stampede by farmers in that direction. Since there is not, basic economics suggests that net returns after considering all costs cannot be that different.
9. Realize that my economic argument is very simple. Lots of caveats could be added. But I think it is a reasonable way to begin the discussion at least in economic terms. Again, great work by my #boilerup friend Mike Langemeier!
10. Finally, gives me the chance to toot the FDD horn. Where else in the world can you find the breadth and depth of agricultural economic analysis found here? Yes, I am extremely proud of the work we do here!!

• • •

Missing some Tweet in this thread? You can try to force a refresh
 

Keep Current with Scott Irwin

Scott Irwin Profile picture

Stay in touch and get notified when new unrolls are available from this author!

Read all threads

This Thread may be Removed Anytime!

PDF

Twitter may remove this content at anytime! Save it as PDF for later use!

Try unrolling a thread yourself!

how to unroll video
  1. Follow @ThreadReaderApp to mention us!

  2. From a Twitter thread mention us with a keyword "unroll"
@threadreaderapp unroll

Practice here first or read more on our help page!

More from @ScottIrwinUI

Aug 8
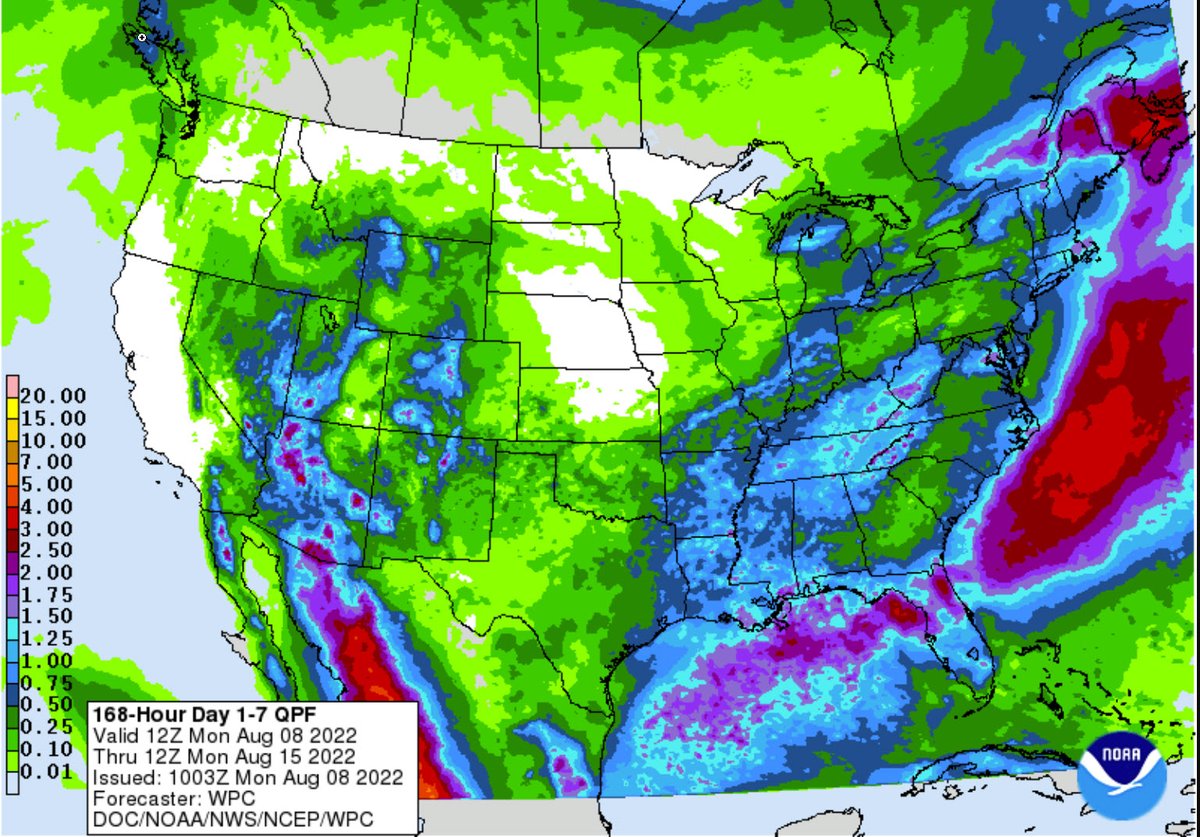
1. State of play on precip in the Corn Belt. Start with 7 day total precip map. Definitely some very nice rain in northern growing areas and some in the east.
2. Here is the 30 day % of normal. Shows the accumulating dryness in the western Corn Belt. Southern half of IA is a major area of concern. Most of the IA has really dried out the last few weeks.
3. Current 7 day total precip map as of this morning. Not good for the dry areas of the Corn Belt out west.
Read 4 tweets
Aug 8
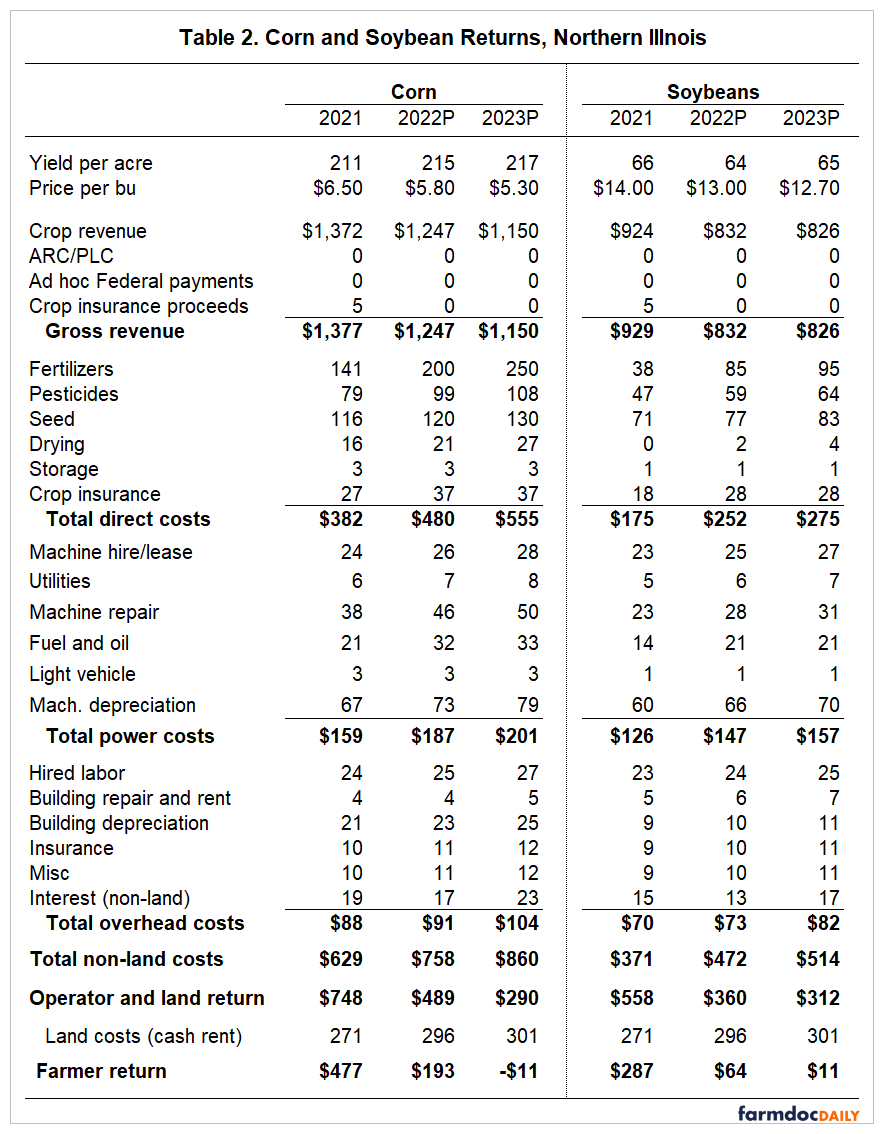
1. Recommended Reading for the Day: 2023 Crop Budgets: Higher Costs and Lower Returns. Some truly eye popping numbers in these first corn and soybean budget projections for 2023 farmdocdaily.illinois.edu/2022/08/2023-c…
2. When I see this chart on costs of producing corn I think "up, up, and away..." Non-land costs have increased dramatically since 2020, from $577 to a projected $860 in 2023, an increase of $283 per acre, or a 49% increase. Think about that. Non-land costs pushing $900.
3. What's the culprit for the huge cost increases for corn? A big chunk is fertilizer (over $100 since 2021), but costs are up across the board.
Read 5 tweets
Jul 8
1. Weekend Reading: I am very excited to discuss my latest article published in AEPP with Dwight Sanders and Lei Yan, "The Order Flow Cost of Index Rolling in Commodity Futures Markets." Seems like a niche topic but ends up having some profound results. onlinelibrary.wiley.com/doi/10.1002/ae…
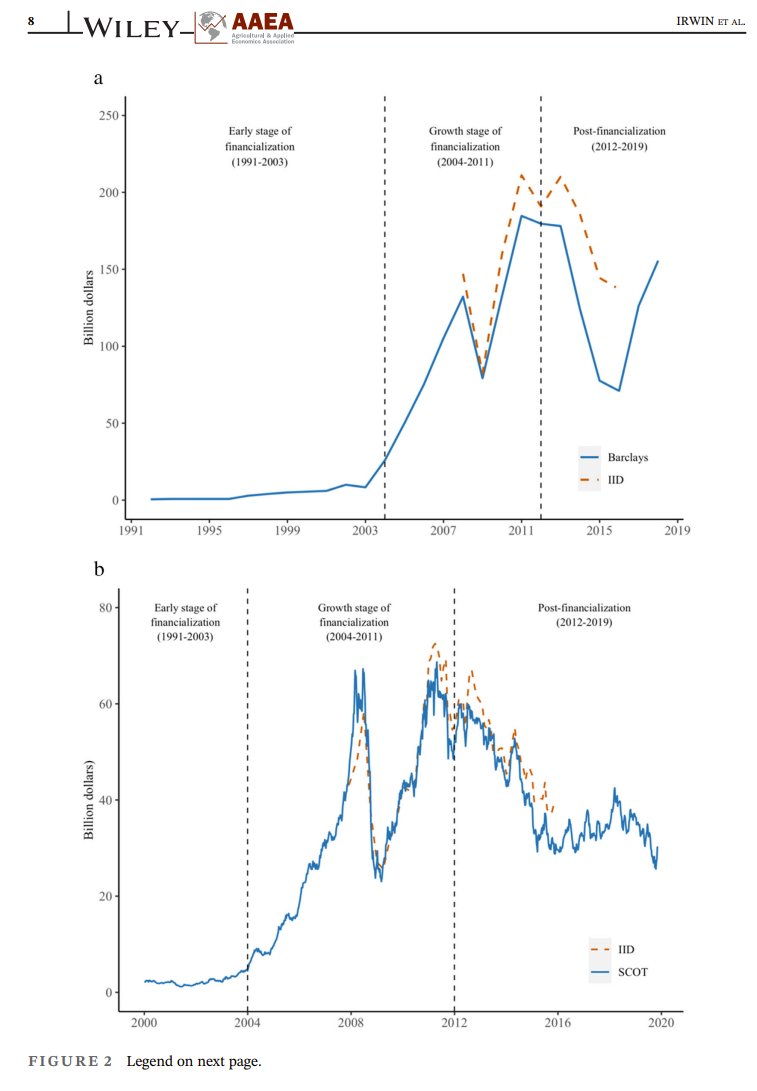
2. This research is a part of the "financialization" literature that studies the impact of large-scale investment in commodity futures markets by financial index investors. You know, the famous GSCI. Some measures of $ investment below and stages of financialization.
3. There is no doubt that financial index flows into commodity futures markets were huge, peaking around 2011. While they have fallen, still very large positions in many commodity futures markets. Long, long, long debate about the price impact of these investment flows.
Read 12 tweets
Jun 29
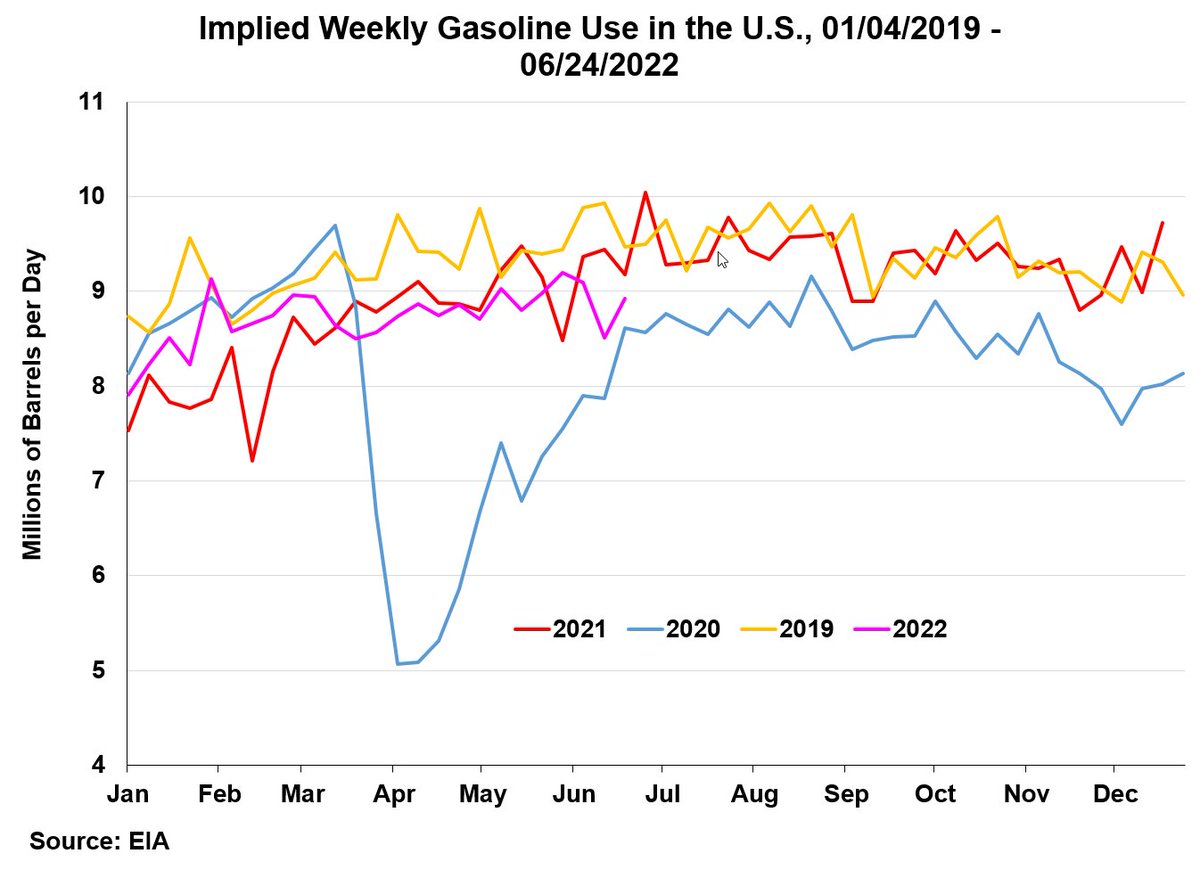
1. Weekly gasoline use number from EIA this morning. Provides a valuable perspective on the impact of $5 gas at the pump. Notice that last year at this time gasoline use finally recovered to the pre-pandemic 2019 level and stayed there for rest of year. (red vs. yellow lines)
2. Now looks at 2022 (purple) vs. 2019 (yellow). Started out strong in 2022, with gasoline usage largely tracking 2019 pre-pandemic level until late February. Then you know what happened on Feb 24 courtesy of comrade Putin.
3. Since the spike in crude oil and gasoline prices post-Ukraine war, US gasoline use has fallen behind both 2019 and 2021 levels. Struggling to reach 9 million barrels per day.
Read 6 tweets
Jun 28
1. With the June Acreage report up on Thursday, good time to review what we know about revisions to USDA planted acreage estimates. My latest #FDD article.
2. Important first finding. Revisions to USDA March Prospective Plantings estimates are unbiased for major crops and total principal crops. Average revisions from March-January very, very close to zero. In other words, statistically unbiased. Image
3. Unbiased does not mean unchanging. Not unusual for corn planted acreage revisions to be up or down as much as 2 million acres. That matters to the market. Key is that ups and downs tend to offset over time. Image
Read 9 tweets
May 27
1. If this is accurate, Ukrainian farmers have managed to plant 78% of last years acreage this year. What a heroic accomplishment in the midst of war. This also means that Ukraine's ag production in 2022 will not be down nearly as much as many feared, if weather is decent.
2. This also confirms my firm belief in the dedication of farmers around the world to plant their crops if there is any way humanly possible to get it done. This impulse is to be greatly admired. Farmers gonna plant. That simple.
3. I wrote in my Time article on April 14th: "I think it is now safe to assume that at least half of Ukraine’s spring crops will be planted, and I will not be surprised if two-thirds or more is planted." Looks like I was too conservative. time.com/6166810/ukrain…
Read 6 tweets

Did Thread Reader help you today?

Support us! We are indie developers!


This site is made by just two indie developers on a laptop doing marketing, support and development! Read more about the story.

Become a Premium Member ($3/month or $30/year) and get exclusive features!

Become Premium

Don't want to be a Premium member but still want to support us?

Make a small donation by buying us coffee ($5) or help with server cost ($10)

Donate via Paypal

Or Donate anonymously using crypto!

Ethereum

0xfe58350B80634f60Fa6Dc149a72b4DFbc17D341E copy

Bitcoin

3ATGMxNzCUFzxpMCHL5sWSt4DVtS8UqXpi copy

Thank you for your support!

Follow Us on Twitter!

:(