Have you ever been curious about how public asset managers are trying to figure out implementing Net Zero across portfolios? Bunch of approaches all with their own nuances and pros/cons. GFANZ portfolio alignment released updated guidance - 140 pages. Here are some highlights.🧵
4 categories of alignment metrics: In increasing complexity, they are 1) binary, 2) maturity scale alignment, 3) benchmark divergence, & 4) implied temperature rise (ITR)
Metrics should be simple, transparent, science-based, broadly applicable, aggregable, and incentive optimal
Metrics should be simple, transparent, science-based, broadly applicable, aggregable, and incentive optimal

Each of these has their own merits and nuances and none of them are perfect in isolation. Unless you have unlimited resource/time, you're likely opting for 1-2 of these approaches.
A drawback of these metrics is that there may be differing data sources and definitions used.
A drawback of these metrics is that there may be differing data sources and definitions used.
1) Binary approach focuses on measuring alignment based on the percentage of portfolio companies with net-zero aligned emission reduction targets.
Ex: 50% of portfolio companies should have validated Net Zero targets.
Pros: easy to measure/track
Cons: doesn't assess credibility
Ex: 50% of portfolio companies should have validated Net Zero targets.
Pros: easy to measure/track
Cons: doesn't assess credibility
2) Maturity scale metrics bucket portfolio companies into alignment categories, for example, based on a categorical scale of “aligned”, “aligning”, “committed to aligning”, or “not aligned”.
Pros: assesses credibility
Cons: lack of consistent standards between managers
Pros: assesses credibility
Cons: lack of consistent standards between managers
3) Benchmark divergence metrics provide the cumulative over or undershoot from a net-zero aligned benchmark.
Ex: Conduct alignment hotspot analysis where companies ranked by overshoot
Pros: most scientifically robust
Cons: which benchmark to use? hard to segment region/sectors
Ex: Conduct alignment hotspot analysis where companies ranked by overshoot
Pros: most scientifically robust
Cons: which benchmark to use? hard to segment region/sectors
4) ITR metrics go one step further by translating this over/undershoot into a science-based, end-of-century global warming outcome.
Pros: Intuitive to understand
Cons: Obscures complexity of underlying assumptions and leads to misuse
Pros: Intuitive to understand
Cons: Obscures complexity of underlying assumptions and leads to misuse
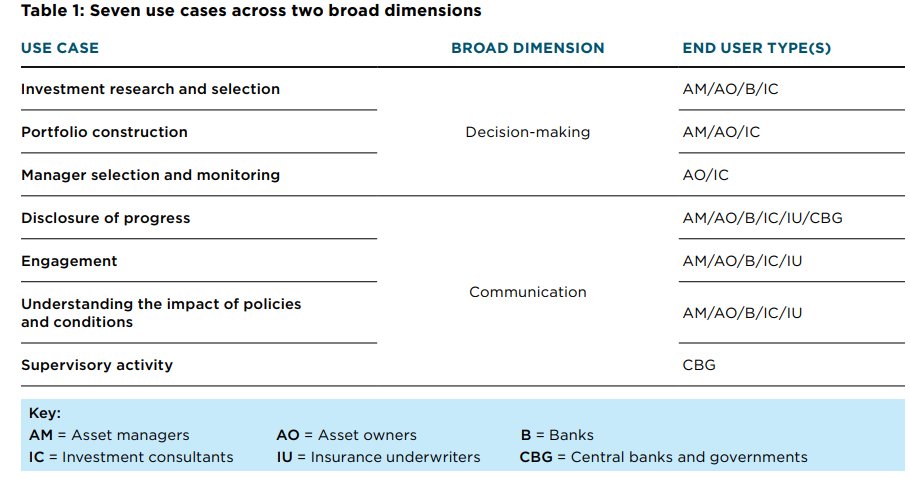
Use cases for these metrics? Boils down to 1) communications aka client reporting and 2) decision-making aka portfolio construction and investment research/decision-making. 1 drives most of this activity today imo but over the long-run w/ better data, 2 will be more important 
Portfolio alignment metrics are effectively the aggregated/compiled result of individual company analysis. Switching gears from portfolio level to company-level.
Four types of companies: providers of 1) climate solutions, companies that are 2) 1.5 degrees C-aligned, 3) companies that need to transition to 1.5 degrees C-aligned, and 4) companies that need to phase out high-emitting assets before their end-of-life 

The idea is if you're managing to a Net Zero portfolio, companies likely fall in one of these 4 buckets. You hold certain companies for the products/services they deliver, their leadership on climate, or engage to get them on a trajectory consistent with Net Zero pathways.
When you're assessing an individual company's trajectory, you're often assessing what targets they have, what pathway they are on, what that compares to regional/sectoral benchmarks, and what they're doing to phase out legacy high emitting assets 

Assessing climate solutions is more opaque, @IIGCCnews recommended four metrics:
- Green investment ratio
- Priority net zero investment ratio
- Green capex intensity alignment metric
-Portfolio carbon return metric measures the emissions abated relative to total investments
- Green investment ratio
- Priority net zero investment ratio
- Green capex intensity alignment metric
-Portfolio carbon return metric measures the emissions abated relative to total investments

The Green investment ratio measures a portfolio’s investment in overall climate solutions relative to total investments and is aligned with the EU’s green taxonomy.
The Priority net zero investment ratio measures each portfolio’s investments in priority technologies or regions relative to its total investments.
The Green capex intensity alignment metric measures the alignment of a sector’s green capex intensity relative to a Paris-aligned benchmark.
The Portfolio carbon return metric measures the emissions abated relative to total investments, helping to quantify the relative impact of investment decisions, similar to the avoided and emissions savings examples illustrated above.
Might say wow - between just the portfolio alignment metrics and company assessments, we already need so much data and it's probably far from consistently reported/standardized measurements, and you'd be 100% right! Need to do the work but the quality of the data is not there yet
Biggest gaps to address? One is Scope 3 - aka company's full supply/value chain emissions. This data might not be available/is incomplete/or inaccurate, so often times large asset managers need to fill in the gaps. Guidance suggests to incorporate where material and available. 

Relative importance of Scope 3 emissions varies across sectors. However, in several high impact, Scope 3 accounts for 40-90% of total emissions.
GFANZ uses 2 criteria for identifying priority sectors:
1) high absolute Scope 3 magnitudes
2) high Scope 3 as % of total


GFANZ uses 2 criteria for identifying priority sectors:
1) high absolute Scope 3 magnitudes
2) high Scope 3 as % of total


"Challenges characterized by an imbalance between disclosed and material emissions, data quality issues, and need for convergence on methodological best practices to reporting Scope 3 emissions"
GFANZ recommends estimating via bottom-up or regression models.
GFANZ recommends estimating via bottom-up or regression models.

Most of this is backward looking, what about where they're going? After all, that's the point of these targets.
Asset managers need to incorporate forward-looking data (emissions trends, production/capacity trends, short-term plans, long-term targets) to get an accurate view
Asset managers need to incorporate forward-looking data (emissions trends, production/capacity trends, short-term plans, long-term targets) to get an accurate view
Asset managers can forecast emissions but DEFINITELY more ART than science.
-Neutral: emissions held constant
-Backward-looking: extrapolate emissions from past trends
-Forward-looking: interpolate emissions data taking a start date, target year, & respective emissions baselines
-Neutral: emissions held constant
-Backward-looking: extrapolate emissions from past trends
-Forward-looking: interpolate emissions data taking a start date, target year, & respective emissions baselines
GFANZ recommends combining elements of backward-looking and forward-looking data. You can probability-weight outcomes.
How much weight you want to put into future targets should tie to your credibility assessment? Historical track records, discussions w/ mgmt, etc.
How much weight you want to put into future targets should tie to your credibility assessment? Historical track records, discussions w/ mgmt, etc.

GFANZ outlines target credibility framework to use different weightings based on whether certain quantitative/qualitative indicators are met.
These includes things like having targets, disclosing green capex, having c-suite tied to achievement of Net Zero outcomes, etc.

These includes things like having targets, disclosing green capex, having c-suite tied to achievement of Net Zero outcomes, etc.


To get a forward view of where your portfolio is headed, you can aggregate individual company metrics (emissions, ITRs, scores).
Few ways to do this too: aggerated budget, portfolio-owned approach, portfolio-weighted approach.
Few ways to do this too: aggerated budget, portfolio-owned approach, portfolio-weighted approach.
Aggregated budget approach uses a weighting based on financed emissions to determine a portfolio or sub-portfolio “owned” portion for each company’s emissions and benchmark using a PCAF attribution factor.
Ex: Own 10% of a company, own 10% of their emissions/budget
Ex: Own 10% of a company, own 10% of their emissions/budget

Portfolio-owned approach is similar but, instead of combining owned emissions/budgets into a single combined trajectory, it simply assigns a weight to the final alignment metric (e.g., ITR) of each investment/company based on proportion of total portfolio-owned emissions 

Portfolio-weight approach calculates the portfolio-level score by weighting individual company alignment metrics (e.g., ITR) by the outstanding values held in the portfolio. It provides insight on the impact of capital-allocation decisions (through respective value of each) 

The official publication can be found here gfanzero.com/publications/
August 2022 is an updated version of the June 2022 document, after incorporating guidance from many institutions assets.bbhub.io/company/sites/…
#GFANZ #NetZero #FinancialInstiutitons #NetZeroPortfolios
August 2022 is an updated version of the June 2022 document, after incorporating guidance from many institutions assets.bbhub.io/company/sites/…
#GFANZ #NetZero #FinancialInstiutitons #NetZeroPortfolios
Asset managers are all grappling with the fact there is no methodological consensus on this stuff and that's why publications like this are released to assess the most realistic options and weigh the pros/cons of them. What will the dominant approach look like in 5-10years?
A lot of dunking on public asset managers and their treatment of net zero. When you get into the practical elements of how to define/measure/assess/use these data and frameworks, it immediately gets complex and there's no clear answers.
Crap I totally forgot to double click on the different ways to look at emissions at a company level which I think is important. Few follow-up tweets:
3 choices of units:
-Absolute emissions (e.g., tons of CO₂)
-Production or production capacity (e.g., barrels of oil produced, number of vehicles sold, watts of electricity generated)
-Emissions intensity (units of absolute emissions per unit of output - physical or economic)
-Absolute emissions (e.g., tons of CO₂)
-Production or production capacity (e.g., barrels of oil produced, number of vehicles sold, watts of electricity generated)
-Emissions intensity (units of absolute emissions per unit of output - physical or economic)
Absolute emissions preserve a direct link to the carbon budget and therefore direct measurement of climate impact. However, measuring absolute emissions can penalize important transition activities, such as organic or inorganic growth or expansion into net-zero technologies
Assessing on production capacity can reinforce link between transition progress and real world emissions. However, using this method might also penalize specific transition activities, including inorganic growth. Capacity also does not reflect differences in production processes.
Intensity metrics compare emissions relative to size/output but key disadvantage is that they rely more heavily on energy demand assumptions compared to absolute emissions, thereby weakening the link to the carbon budget.
Ex O&G co can lower intensity but grow absolute emisisons
Ex O&G co can lower intensity but grow absolute emisisons

There's so many more rabbit holes I can go down - how to use benchmarks/pathways that adjust for regions (developed markets vs. emerging) or how do you adjust carbon budgets for companies taking share from others or how do you ensure everyone uses same reference base cases...
Ultimately Net Zero measurement/alignment will come down to client (asset owner) preference - what are they seeking to measure, what can they intuitively understand, and can the asset manager reliably deliver against those outcomes and reporting requirements.
Likes/shares are appreciated if you learned something useful or found the content helpful! I spend a lot of time thinking about Corporations and the achievement of Net Zero targets so this is core to what I do day-to-day
• • •
Missing some Tweet in this thread? You can try to
force a refresh


