The @COVID_19_Canada Canadian Excess Mortality Tracker is now up.
Data are current up to today's update from @StatCan_eng (to Jun 4/22)
Link to webpage with all the data and visualizations:
covid19resources.ca/public/excess-…
Data are current up to today's update from @StatCan_eng (to Jun 4/22)
Link to webpage with all the data and visualizations:
covid19resources.ca/public/excess-…
@COVID_19_Canada @StatCan_eng Please bear with us as we tinker with display settings. We're in the middle of converting the website to a simpler version, and there are glitches.
I'll do a thread summarizing some of the major insights from the excess mortality data here.
cc @DFisman @cdavidnaylor @AshTuite
I'll do a thread summarizing some of the major insights from the excess mortality data here.
cc @DFisman @cdavidnaylor @AshTuite
@COVID_19_Canada @StatCan_eng @DFisman @cdavidnaylor @AshTuite First, the Table of Contents.
It lists the sections of the Canadian Excess Mortality Dashboard, with links, as well as brief descriptions of methods and (linked) sources.
We still have to translate, add ALT-text and explanatory text more geared to non-scientist readers.
It lists the sections of the Canadian Excess Mortality Dashboard, with links, as well as brief descriptions of methods and (linked) sources.
We still have to translate, add ALT-text and explanatory text more geared to non-scientist readers.

@COVID_19_Canada @StatCan_eng @DFisman @cdavidnaylor @AshTuite All estimates we present are directly pulled from @StatCan_eng current estimates of excess and expected weekly mortality rates in each age group. We subtract excess deaths in each age group attributable to toxic drugs, the 2021 BC heat dome and 2020 Portapique NS shootings.
@COVID_19_Canada @StatCan_eng @DFisman @cdavidnaylor @AshTuite We're using 7-week, mid-centred rolling averages for all parameters. This helps to reduce the bounce of data in smaller provinces and age groups with smaller numbers of weekly deaths, because the value in any given week is the average of flanking positive and negative values.
@COVID_19_Canada @StatCan_eng @DFisman @cdavidnaylor @AshTuite Here's a summary of new weekly % excess mortality by age group and age-adjusted reported COVID deaths/100,000 people for CANADA.
Death reporting is not yet sufficiently complete for all regions past June 6, 2020 (yes, 2020). Regional comparisons after this date are less certain.
Death reporting is not yet sufficiently complete for all regions past June 6, 2020 (yes, 2020). Regional comparisons after this date are less certain.

@COVID_19_Canada @StatCan_eng @DFisman @cdavidnaylor @AshTuite Table at bottom right shows cumulative totals.
As of Jun 6, 2020, there may be ~1K deaths that haven't yet been reported in Canada, but some of this may be deaths in regions with smaller first waves. Specific cause of death reporting is missing for ~2K deaths up to this date.
As of Jun 6, 2020, there may be ~1K deaths that haven't yet been reported in Canada, but some of this may be deaths in regions with smaller first waves. Specific cause of death reporting is missing for ~2K deaths up to this date.

@COVID_19_Canada @StatCan_eng @DFisman @cdavidnaylor @AshTuite The bottom right table also shows that at least 55K expected deaths from Feb 22/20 to June 4/22 have not yet been reported to the Canadian Vital Statistics Death database.
Specific cause of death reporting is missing for at least 72K deaths for this period.
Specific cause of death reporting is missing for at least 72K deaths for this period.

@COVID_19_Canada @StatCan_eng @DFisman @cdavidnaylor @AshTuite Basically, what this means is that we'll likely still be seeing considerably more deaths come in, and increases in excess mortality estimates for the period since Jun 6/20, despite the best efforts of @StatCan_eng to statistically compensate for slow provincial reporting.
@COVID_19_Canada @StatCan_eng @DFisman @cdavidnaylor @AshTuite There are a ton more summary parameters in the bottom right table. You need to scroll down using the slider on the right to see all of them.

@COVID_19_Canada @StatCan_eng @DFisman @cdavidnaylor @AshTuite The blue box on at left, middle gives the most recent date to which a province has reported any deaths at all to Canadian Vital Statistics Deaths (CVS-D). For Canada this is a mixture of dates, but as you go through the slides for every province you'll see specific dates.

@COVID_19_Canada @StatCan_eng @DFisman @cdavidnaylor @AshTuite The blue text box also emphasizes just how important it is NOT to conclude that excess mortality is declining for more recent dates. This is an artefact of very slow and incomplete death reporting.
I repeat, excess mortality will still increase considerably for later dates.
I repeat, excess mortality will still increase considerably for later dates.

@COVID_19_Canada @StatCan_eng @DFisman @cdavidnaylor @AshTuite Finally, the table at bottom right lists total age-adjusted all-cause excess and COVID deaths/100K (first and second rows), and cumulative % excess mortality since Feb 22/20.
I repeat....these excess mortality estimates are still artefactually low for most provinces.
I repeat....these excess mortality estimates are still artefactually low for most provinces.

@COVID_19_Canada @StatCan_eng @DFisman @cdavidnaylor @AshTuite OK, let's start describing the data for Canada.
As we do this, you can apply some of what I'm discussing when you look at the pages for your province. The format for these pages is the same for all regions.
As we do this, you can apply some of what I'm discussing when you look at the pages for your province. The format for these pages is the same for all regions.
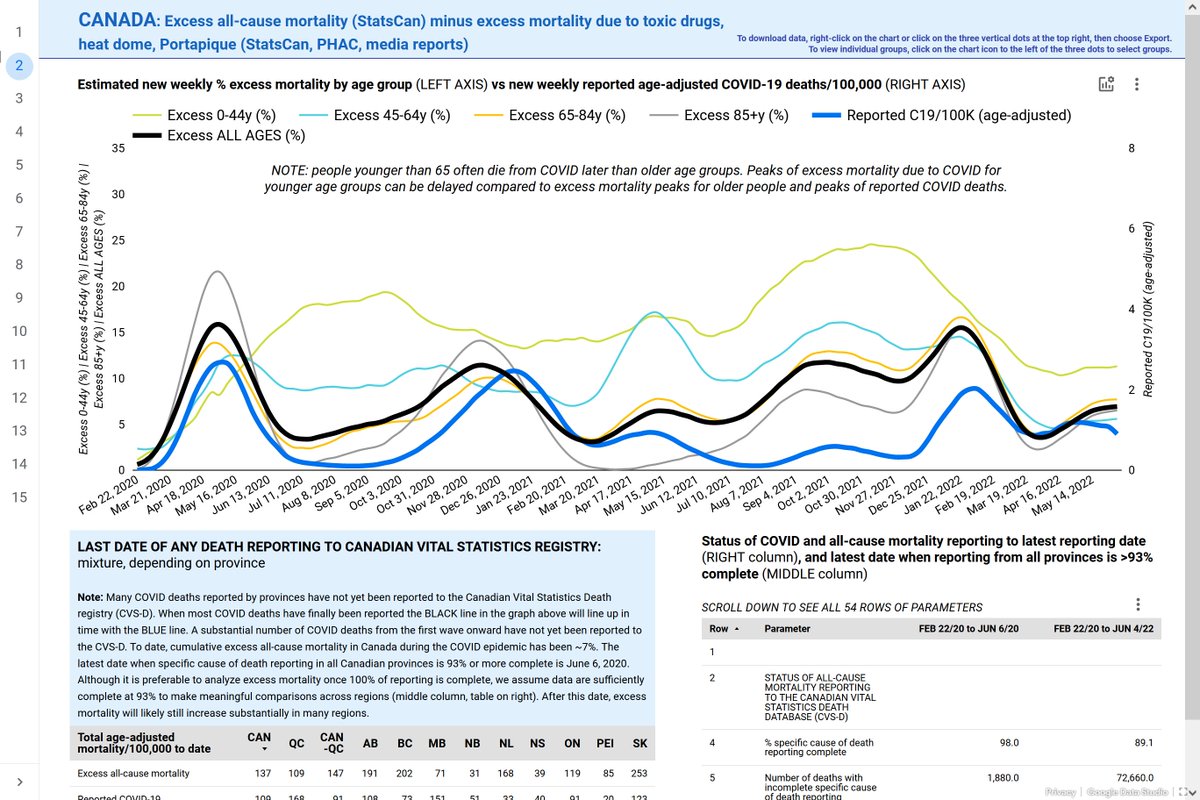
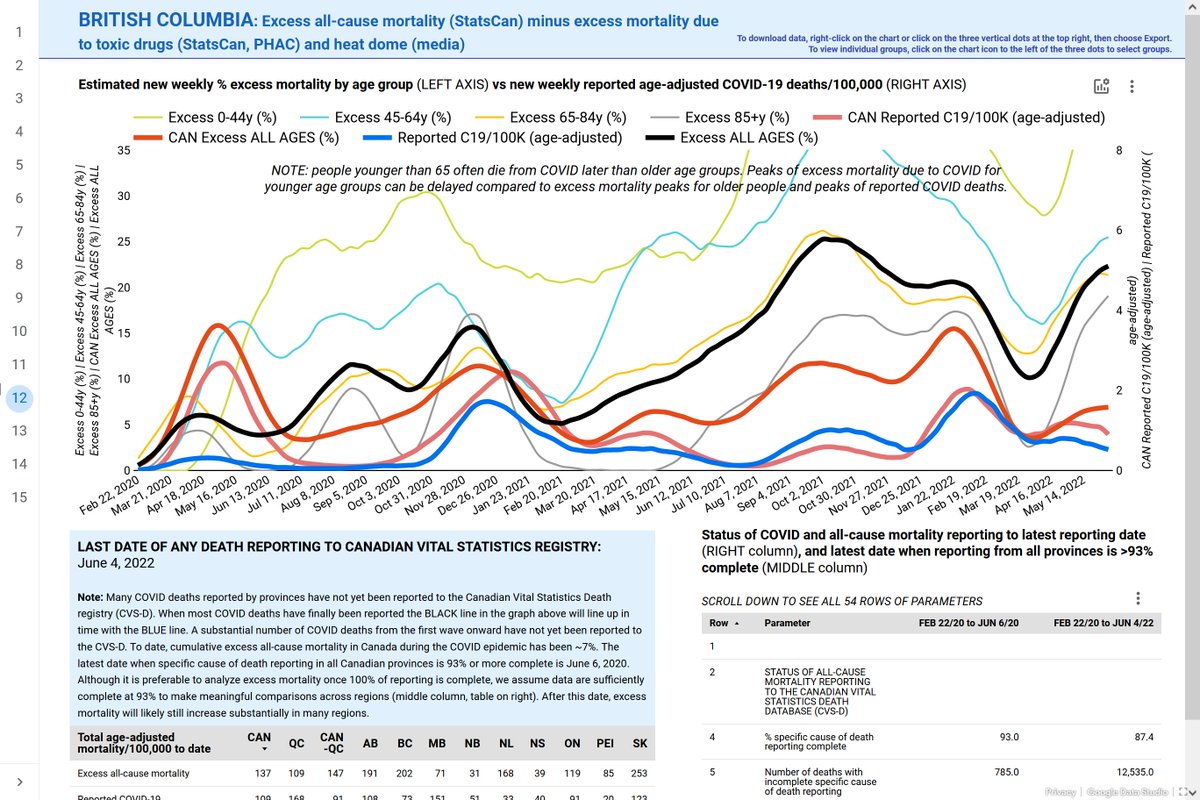
@COVID_19_Canada @StatCan_eng @DFisman @cdavidnaylor @AshTuite The graph for Canada shows the age-adjusted reported COVID deaths/100,000 plotted on the right axis. It's the dark blue line.
% excess mortality is plotted on the left axis.
Line colours:
All ages BLACK
0-44 years (y) OLIVE GREEN
45-64y LIGHT BLUE
65-84y GOLD
85+y GRAY
% excess mortality is plotted on the left axis.
Line colours:
All ages BLACK
0-44 years (y) OLIVE GREEN
45-64y LIGHT BLUE
65-84y GOLD
85+y GRAY

@COVID_19_Canada @StatCan_eng @DFisman @cdavidnaylor @AshTuite If you want to look at any individual group by itself, click the little graph icon on the top left of the chart to select the groups you want.
You can also download the data by clicking on the three vertical dots beside the graph icon and choosing "Export".
You can also download the data by clicking on the three vertical dots beside the graph icon and choosing "Export".

@COVID_19_Canada @StatCan_eng @DFisman @cdavidnaylor @AshTuite There are a whole bunch of observations to extract from the chart for Canada.
Here are some, in no particular order. I suspect we collectively need to do a lot of reflection about these data.
Here are some, in no particular order. I suspect we collectively need to do a lot of reflection about these data.
@COVID_19_Canada @StatCan_eng @DFisman @cdavidnaylor @AshTuite First, it's clear that excess ALL AGES mortality in the first Omicron wave in Canada will likely be greater than excess ALL AGES mortality for the first wave of the COVID epidemic in Canada by the time StatsCan releases next month's update.

@COVID_19_Canada @StatCan_eng @DFisman @cdavidnaylor @AshTuite Second, ALL AGES excess deaths precede but generally coincide with reported COVID deaths.
After Apr/21, despite similar temporal patterns we see a divergence in the scale of reported COVID deaths and excess mortality. Excess mortality increases. Reported COVID deaths decrease.
After Apr/21, despite similar temporal patterns we see a divergence in the scale of reported COVID deaths and excess mortality. Excess mortality increases. Reported COVID deaths decrease.

@COVID_19_Canada @StatCan_eng @DFisman @cdavidnaylor @AshTuite Some of this divergence probably represents the beginning of an increase in mortality due to delays in medical diagnosis and care during earlier stages of the epidemic, but especially from the spring onward, which is when hospitals really started to be hit by COVID.

@COVID_19_Canada @StatCan_eng @DFisman @cdavidnaylor @AshTuite We even see this divergence in Quebec starting at about the beginning of July/21, even though QC has historically been excellent at detecting and reporting most/all of its COVID deaths.

@COVID_19_Canada @StatCan_eng @DFisman @cdavidnaylor @AshTuite Two other things were happening during this period.
1. The arrival and takeover of Delta, which had higher mortality rates in most age groups than preceding variants.
2. Most people older than 12 had received at least 1 vaccine dose.
1. The arrival and takeover of Delta, which had higher mortality rates in most age groups than preceding variants.
2. Most people older than 12 had received at least 1 vaccine dose.

@COVID_19_Canada @StatCan_eng @DFisman @cdavidnaylor @AshTuite We won't have specific cause of death data for 2021 from StatsCan until Jan/23, so it's hard to know how much of this divergence is because of challenges accessing life-saving medical care, and how much is due to under-detection/under-attribution/under-reporting of COVID deaths.

@COVID_19_Canada @StatCan_eng @DFisman @cdavidnaylor @AshTuite I've started working on a crude way to try to estimate warning "signals" of significant age-adjusted increases in weekly from the top 10 causes of mortality from 2021 and 2022 reported by StatsCan.
If I can figure this out I'll post to our website and notify you here.
If I can figure this out I'll post to our website and notify you here.
@COVID_19_Canada @StatCan_eng @DFisman @cdavidnaylor @AshTuite The other striking thing that stands out is just how high % excess mortality has been for people younger than 65 throughout the epidemic, even after adjusting for excess mortality attributable to toxic drugs.
This looks a lot like UK and US COVID AND excess mortality data.
This looks a lot like UK and US COVID AND excess mortality data.

@COVID_19_Canada @StatCan_eng @DFisman @cdavidnaylor @AshTuite Frankly, Canada has never reported the number of COVID deaths in people <65 that we'd expect given the number of deaths we've reported in older age groups. We REALLY under-detect/report COVID deaths in younger people, maybe because we have an incorrect mental picture of who dies.
@COVID_19_Canada @StatCan_eng @DFisman @cdavidnaylor @AshTuite But.... if we look at specific causes of death that changed significantly in Canada 2020 (slide 15 at the link at the top of the thread), it's clear that for people younger than 65 there was also a significant increase in death from alcoholic liver disease.

@COVID_19_Canada @StatCan_eng @DFisman @cdavidnaylor @AshTuite The significant increase in deaths from alcoholic liver disease is still nowhere near the magnitude of increased % excess mortality in these age groups, though. "Subtracting" these deaths would reduce % excess mortality by maybe 10-20%.
So what's going on?
So what's going on?
@COVID_19_Canada @StatCan_eng @DFisman @cdavidnaylor @AshTuite It IS very likely that some drug-related deaths in this age group have been missed.
QC has lower per capita rates of reported toxic drug deaths than many provinces. And given the quality of death reporting in the province it's less likely that drug deaths have been missed in QC.
QC has lower per capita rates of reported toxic drug deaths than many provinces. And given the quality of death reporting in the province it's less likely that drug deaths have been missed in QC.

@COVID_19_Canada @StatCan_eng @DFisman @cdavidnaylor @AshTuite In Quebec, we do see elevated excess mortality in people younger than 65 that is clearly temporally linked to COVID death waves. Cumulative excess mortality to date from periods linked to COVID surges/waves is greater than reported COVID deaths in these age groups, even in QC.

@COVID_19_Canada @StatCan_eng @DFisman @cdavidnaylor @AshTuite And yes, even in Quebec the number of reported COVID deaths in younger age groups is lower than would be expected based on OECD age-specific infection fatality rates for corresponding variants and COVID seroprevalence data. So, even QC is likely missing younger COVID deaths.
@COVID_19_Canada @StatCan_eng @DFisman @cdavidnaylor @AshTuite But, the magnitude of % excess mortality in younger age groups compared to QC during COVID suggests that there's more going on in these provinces than "just" a hell of a lot of missed COVID deaths.
@COVID_19_Canada @StatCan_eng @DFisman @cdavidnaylor @AshTuite One more note before I change topics. In the 2020 specific cause of death data, you can see that by far the largest % increase in mortality in all age groups combined, and each one individually, was a catch-all category for "we don't know" called non-specific signs and symptoms.

@COVID_19_Canada @StatCan_eng @DFisman @cdavidnaylor @AshTuite The non-specific/unspecified cause of death category is ~10X higher than any other category where there were significant % increases in mortality in 2020.
In other words "we don't know" vastly outstrips any other cause of death, including drug- and alcohol-related deaths.
In other words "we don't know" vastly outstrips any other cause of death, including drug- and alcohol-related deaths.
@COVID_19_Canada @DFisman @cdavidnaylor @AshTuite Among people 0-44y there was a significant 29% increase in deaths attributed to diabetes in 2020. Among people 45-64y there were respectively significant 34%, 10% and 3% increases in kidney diseases, diabetes and major cardiovascular diseases. Many of these may be COVID-linked.
@COVID_19_Canada @DFisman @cdavidnaylor @AshTuite Anyway, we'll be trying to tease this apart for years. And we know people working age and younger have had higher COVID infection rates than older folk, so it's not surprising if a chunk of that is COVID-linked. But the magnitude of that % increase is very concerning.
@COVID_19_Canada @DFisman @cdavidnaylor @AshTuite One last clarifying point...even if the % excess mortality in younger groups has often been higher than older age groups, this doesn't mean that there were more deaths among younger people. It just means that observed deaths were higher than expected for the same age group.
@COVID_19_Canada @DFisman @cdavidnaylor @AshTuite For the most part, % excess mortality for all age groups follows % excess mortality for people 65-84 pretty closely, which is what we'd expect for COVID, given higher baseline rates of death from any cause for people 85 and older.

@COVID_19_Canada @DFisman @cdavidnaylor @AshTuite Now I'll show the graphs for each province, although I'll restrict myself to brief comments since I still have a lot of thinking to do.
Here's Quebec, which you've seen already.
Here's Quebec, which you've seen already.

@COVID_19_Canada @DFisman @cdavidnaylor @AshTuite For each province, I provide reference curves for Canada for comparison:
Canada % excess mortality, all ages: DARKER RED
Canada age-adjusted reported COVID deaths/100K: LIGHTER RED
Compared to Canada, QC excess mortality was worse in 1st wave, then progressively improved.
Canada % excess mortality, all ages: DARKER RED
Canada age-adjusted reported COVID deaths/100K: LIGHTER RED
Compared to Canada, QC excess mortality was worse in 1st wave, then progressively improved.

@COVID_19_Canada @DFisman @cdavidnaylor @AshTuite Quebec is also much further along for Omicron period death reporting than other provinces, so it's likely Canada will likely shift up relative to QC for the Omicron era too.
@COVID_19_Canada @DFisman @cdavidnaylor @AshTuite BTW if you're getting kind of tired of this slow-moving thread and want the final take-home numbers, you can go to the Table of Contents on the website and skip to the Summary Tables section.

@COVID_19_Canada @DFisman @cdavidnaylor @AshTuite The Summary Tables show cumulative totals up to June 6, 2020 (the last fairly complete data for death reporting: middle columns), as well as up to June 4, 2022 (right columns).
The upper table on Slide 13 shows details of COVID and non-COVID death reporting status by province.
The upper table on Slide 13 shows details of COVID and non-COVID death reporting status by province.
@COVID_19_Canada @DFisman @cdavidnaylor @AshTuite The lower table on Slide 13 shows cumulative excess mortality and the number of unexplained excess deaths that have not been attributed to COVID, toxic drugs, heat dome, Portapique shootings.
FWIW in Quebec, you'll note that this number is zero, even to June 6, 2022.
FWIW in Quebec, you'll note that this number is zero, even to June 6, 2022.

@COVID_19_Canada @DFisman @cdavidnaylor @AshTuite On slide 14 you can find all the breakdowns of excess mortality data by age group.
Don't forget to use the sliders on tables to see all the rows. I tend to be a little over the top showing everything you might want to know. But still there is so much missing info :)
Don't forget to use the sliders on tables to see all the rows. I tend to be a little over the top showing everything you might want to know. But still there is so much missing info :)

@COVID_19_Canada @DFisman @cdavidnaylor @AshTuite Back to Canada data:
To Jun 6/22,
Excess mortality, all ages: 52K
Reported COVID deaths: 41.4K
Specific cause of death reporting 89% complete (73K outstanding)
~56K expected (all-cause) deaths still unreported to CVS-D
To Jun 6/22,
Excess mortality, all ages: 52K
Reported COVID deaths: 41.4K
Specific cause of death reporting 89% complete (73K outstanding)
~56K expected (all-cause) deaths still unreported to CVS-D

@COVID_19_Canada @DFisman @cdavidnaylor @AshTuite QUEBEC
Excess mortality, all ages: 10.1K (remember, lagging)
Reported COVID deaths: 15.5K
Specific cause of death reporting 97% complete (4K outstanding)
~4K expected (all-cause) deaths still unreported to CVS-D
Unexplained excess deaths: 0
Excess mortality, all ages: 10.1K (remember, lagging)
Reported COVID deaths: 15.5K
Specific cause of death reporting 97% complete (4K outstanding)
~4K expected (all-cause) deaths still unreported to CVS-D
Unexplained excess deaths: 0

@COVID_19_Canada @DFisman @cdavidnaylor @AshTuite NEWFOUNDLAND & LABRADOR
Excess mortality, all ages: 950
Reported COVID deaths: 185
Specific cause of death reporting 83% complete (2.3K outstanding)
~500 expected (all-cause) deaths still unreported to CVS-D
Unexplained excess deaths: 750
Excess mortality, all ages: 950
Reported COVID deaths: 185
Specific cause of death reporting 83% complete (2.3K outstanding)
~500 expected (all-cause) deaths still unreported to CVS-D
Unexplained excess deaths: 750

@COVID_19_Canada @DFisman @cdavidnaylor @AshTuite PRINCE EDWARD ISLAND
Excess mortality, all ages: 150
Reported COVID deaths: 34
Specific cause of death reporting 88% complete (300 outstanding)
~1.1K expected (all-cause) deaths still unreported to CVS-D
Unexplained excess deaths: 115
Excess mortality, all ages: 150
Reported COVID deaths: 34
Specific cause of death reporting 88% complete (300 outstanding)
~1.1K expected (all-cause) deaths still unreported to CVS-D
Unexplained excess deaths: 115

@COVID_19_Canada @DFisman @cdavidnaylor @AshTuite NOVA SCOTIA
Excess mortality, all ages: 410
Reported COVID deaths: 415
Specific cause of death reporting 81% complete (3.2K outstanding)
~7.3K expected (all-cause) deaths still unreported to CVS-D
Unexplained excess deaths: 0
Excess mortality, all ages: 410
Reported COVID deaths: 415
Specific cause of death reporting 81% complete (3.2K outstanding)
~7.3K expected (all-cause) deaths still unreported to CVS-D
Unexplained excess deaths: 0

@COVID_19_Canada @DFisman @cdavidnaylor @AshTuite Important: Nova Scotia hasn't reported any deaths at all to CVS-D since October 23, 2021, so the excess mortality estimates are likely very low.
@COVID_19_Canada @DFisman @cdavidnaylor @AshTuite NEW BRUNSWICK
Excess mortality, all ages: 250
Reported COVID deaths: 421
Specific cause of death reporting 94% complete (800 outstanding)
~5K expected (all-cause) deaths still unreported to CVS-D
Unexplained excess deaths: 0
Excess mortality, all ages: 250
Reported COVID deaths: 421
Specific cause of death reporting 94% complete (800 outstanding)
~5K expected (all-cause) deaths still unreported to CVS-D
Unexplained excess deaths: 0

@COVID_19_Canada @DFisman @cdavidnaylor @AshTuite Important: NB death reporting to CVS-D, or at least the reporting thereof by StatsCan, appears to have gone back in time compared to last month's update.
No deaths due to any cause are in the CVS-D after Dec 18/21, so the excess mortality estimates still likely very low.
No deaths due to any cause are in the CVS-D after Dec 18/21, so the excess mortality estimates still likely very low.
@COVID_19_Canada @DFisman @cdavidnaylor @AshTuite There also appears to be a data glitch for NB ~Apr 2020. I've double-checked my formulas to make sure I didn't introduce it (although I do make mistakes!).
I'm not sure what's happening with NB now, since excess mortality estimates have plunged compared to last StatsCan release.
I'm not sure what's happening with NB now, since excess mortality estimates have plunged compared to last StatsCan release.
@COVID_19_Canada @DFisman @cdavidnaylor @AshTuite I think fall 2021 excess mortality estimates will likely go back up again for NB, based on what we see for other Atlantic provinces, and suspect there are some background reporting challenges going on.
So, we'll have to hold off on interpreting NB data till next month, I think.
So, we'll have to hold off on interpreting NB data till next month, I think.
@COVID_19_Canada @DFisman @cdavidnaylor @AshTuite ONTARIO
Excess mortality, all ages: 17.4K
Reported COVID deaths: 13.3K
Specific cause of death reporting 91% complete (22.3K outstanding)
~26K expected (all-cause) deaths still unreported to CVS-D
Unexplained excess deaths: 4.1K
Excess mortality, all ages: 17.4K
Reported COVID deaths: 13.3K
Specific cause of death reporting 91% complete (22.3K outstanding)
~26K expected (all-cause) deaths still unreported to CVS-D
Unexplained excess deaths: 4.1K

@COVID_19_Canada @DFisman @cdavidnaylor @AshTuite Note: peak of excess all ages mortality in first Omicron wave has already exceeded peak of first wave of COVID epidemic in Ontario, even with no deaths at all reported by the province since March 12, 2022.
I will refrain from commenting further.
I will refrain from commenting further.

@COVID_19_Canada @DFisman @cdavidnaylor @AshTuite MANITOBA
Excess mortality, all ages: 1K
Reported COVID deaths: 2K
Specific cause of death reporting 61% complete (6.3K outstanding)
~11K expected (all-cause) deaths still unreported to CVS-D
Unexplained excess deaths: 0
Excess mortality, all ages: 1K
Reported COVID deaths: 2K
Specific cause of death reporting 61% complete (6.3K outstanding)
~11K expected (all-cause) deaths still unreported to CVS-D
Unexplained excess deaths: 0

@COVID_19_Canada @DFisman @cdavidnaylor @AshTuite Note: Manitoba has not reported any deaths at all to the CVS-D since June 26, 2021, so you can imagine how much excess mortality is currently under-estimated for the province.
@COVID_19_Canada @DFisman @cdavidnaylor @AshTuite SASKATCHEWAN
Excess mortality, all ages: 2.9K
Reported COVID deaths: 1.4K
Specific cause of death reporting 59% complete (9.8K outstanding)
Min 800 expected (all-cause) deaths still unreported to CVS-D
Unexplained excess deaths: 1.5K
Excess mortality, all ages: 2.9K
Reported COVID deaths: 1.4K
Specific cause of death reporting 59% complete (9.8K outstanding)
Min 800 expected (all-cause) deaths still unreported to CVS-D
Unexplained excess deaths: 1.5K
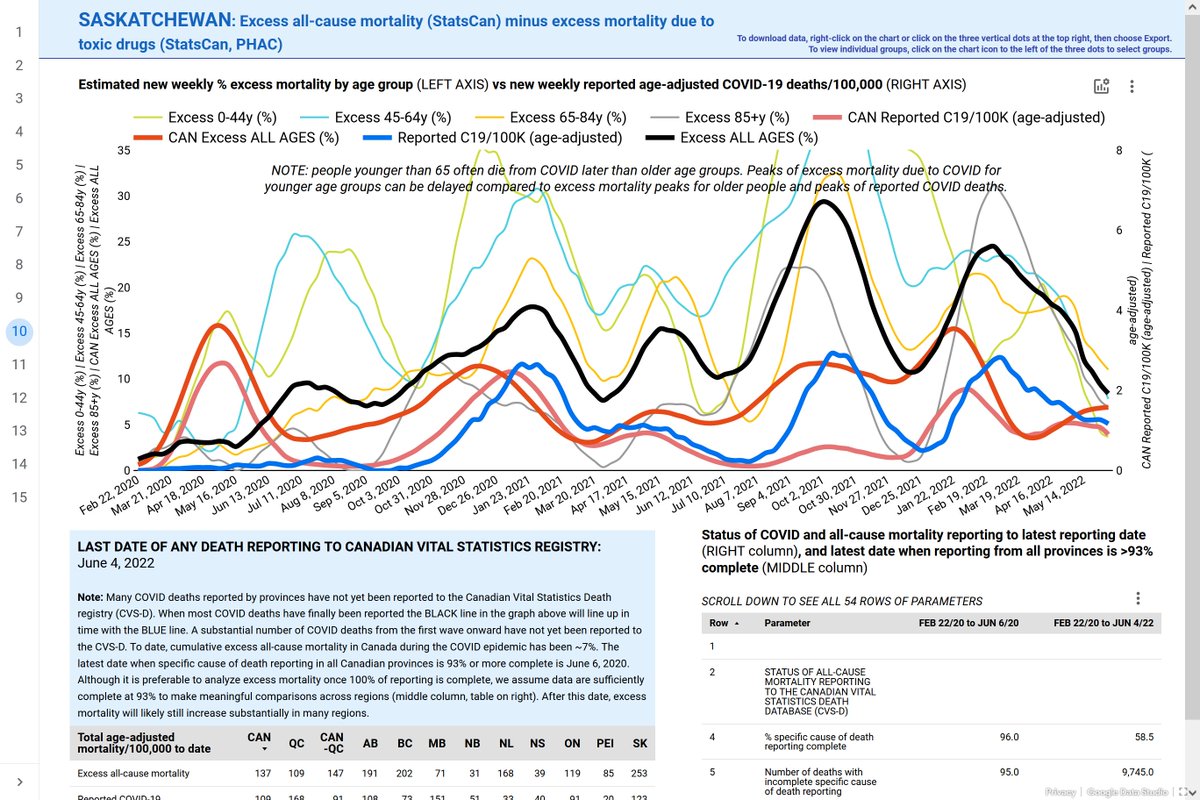
@COVID_19_Canada @DFisman @cdavidnaylor @AshTuite So many things to note for Saskatchewan, but I need to comment on something I should have pointed out earlier.
The scale of the left y-axis is set at the same maximum across all datasets. This is to facilitate visual comparison.
The scale of the left y-axis is set at the same maximum across all datasets. This is to facilitate visual comparison.
@COVID_19_Canada @DFisman @cdavidnaylor @AshTuite In many provinces the % excess mortality in younger age groups soars pretty high above that 35% max, but it's also important to see the trends for older age groups, which constitute the bulk of excess mortality on a population level during COVID.
So, imperfect compromise...
So, imperfect compromise...
ALBERTA
Excess mortality, all ages: 8.1K
Reported COVID deaths: 4.6K
Specific cause of death reporting 85% complete (10.4K outstanding)
Min 50 expected (all-cause) deaths still unreported to CVS-D
Unexplained excess deaths: 3.5K
Excess mortality, all ages: 8.1K
Reported COVID deaths: 4.6K
Specific cause of death reporting 85% complete (10.4K outstanding)
Min 50 expected (all-cause) deaths still unreported to CVS-D
Unexplained excess deaths: 3.5K

I think Alberta's data speak for themselves.
I will also refrain from further comment on Canada's current champion of unexplained per capita and total excess mortality, British Columbia.
I will also refrain from further comment on Canada's current champion of unexplained per capita and total excess mortality, British Columbia.
BRITISH COLUMBIA
Excess mortality, all ages: 11.1K
Reported COVID deaths: 3.6K
Specific cause of death reporting 87% complete (12.5K outstanding)
Min 100 expected (all-cause) deaths still unreported to CVS-D
Unexplained excess deaths: 7.1K
Excess mortality, all ages: 11.1K
Reported COVID deaths: 3.6K
Specific cause of death reporting 87% complete (12.5K outstanding)
Min 100 expected (all-cause) deaths still unreported to CVS-D
Unexplained excess deaths: 7.1K
On that discouraging note, I'm going to stop this thread so I can respond to questions.
Questions, comments, suggestions all welcome. Today is the first day we're posting this, and we know there's still a lot of information people would like, not to mention "lay" explainers.
Questions, comments, suggestions all welcome. Today is the first day we're posting this, and we know there's still a lot of information people would like, not to mention "lay" explainers.
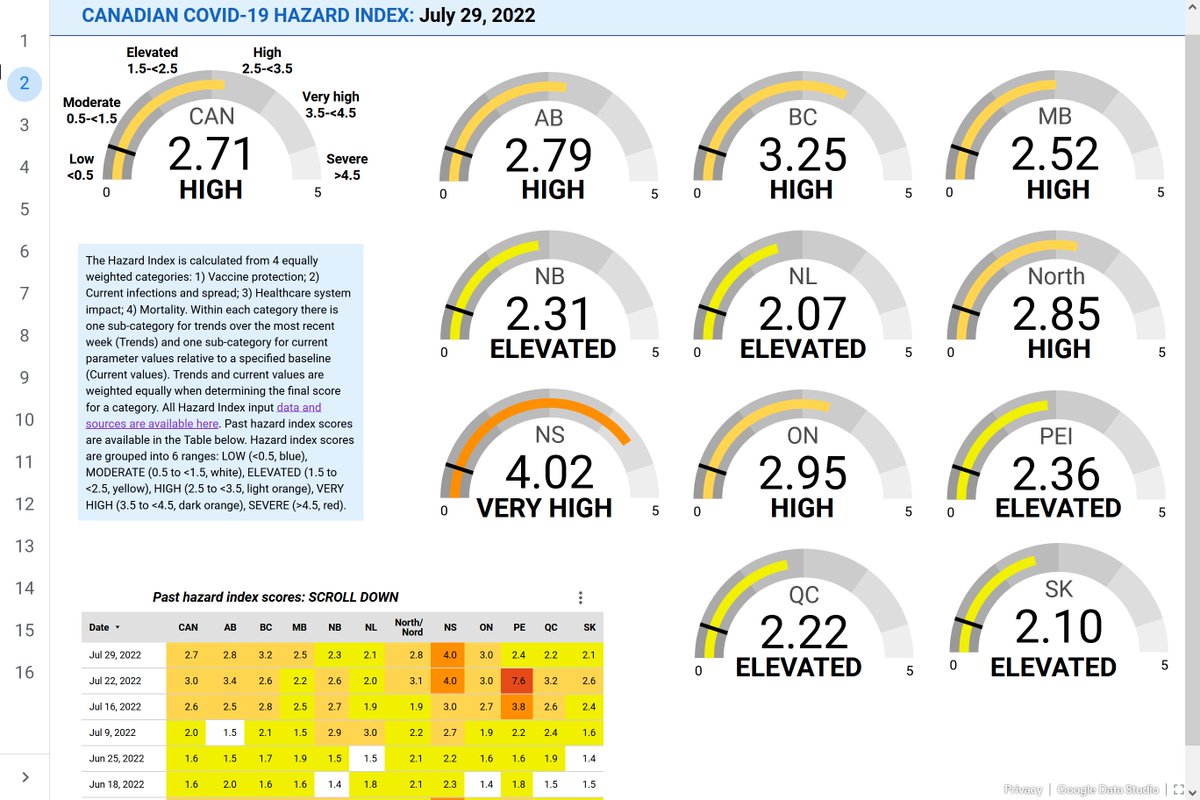
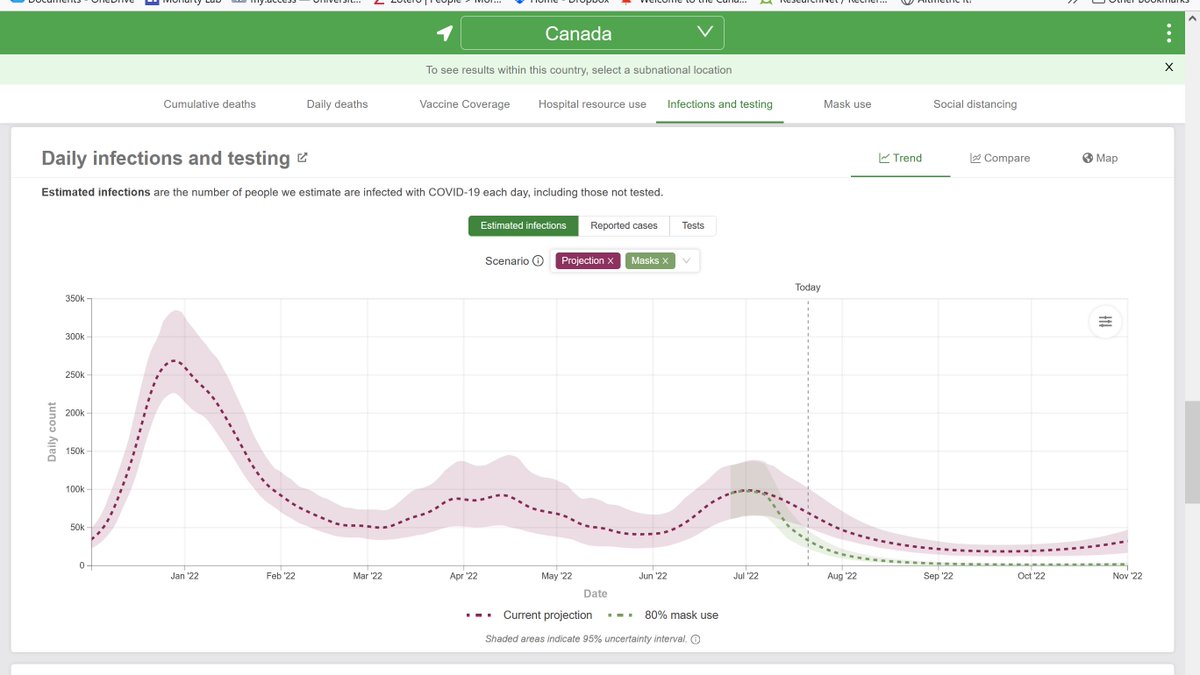
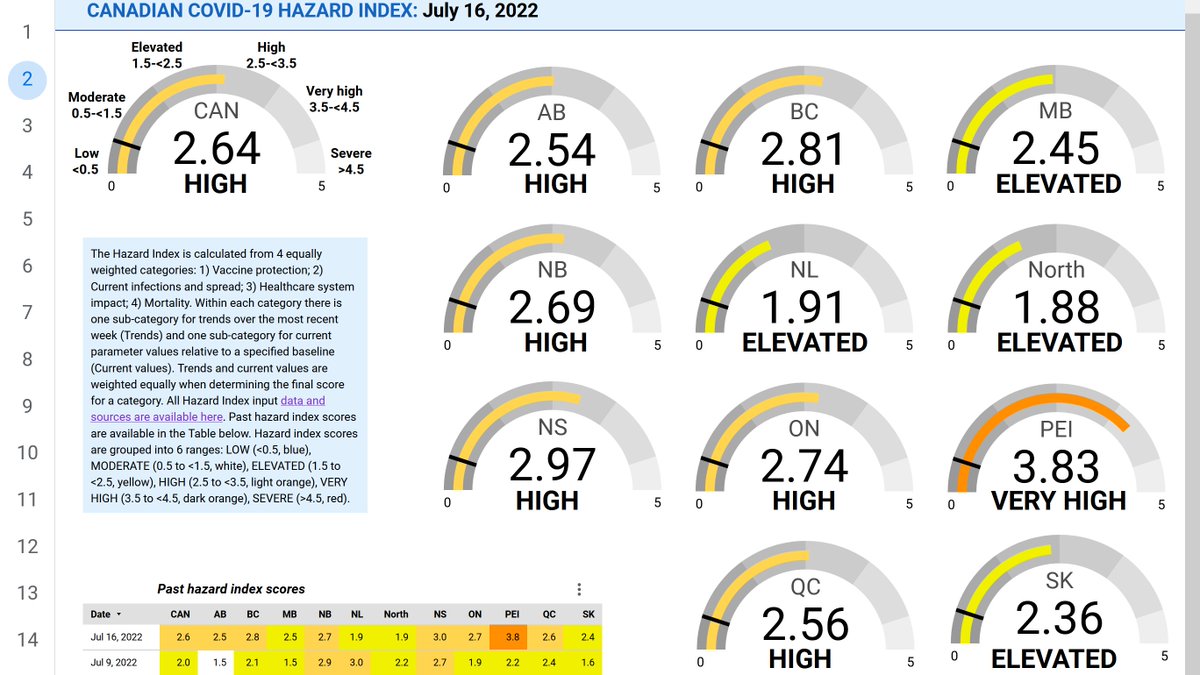
We'll post this week's Canadian COVID Hazard index and associated Canadian COVID data tomorrow/Saturday.
covid19resources.ca/covid-hazard-i…
covid19resources.ca/covid-hazard-i…
As always, if you have questions about excess mortality, hazard index or other Canadian COVID data we share...
We hold free, public Data Discussions on Tues evenings.
And general COVID Q&A/kitchen table discussions on Wed evenings.
#StrongerTogether
covid19resources.ca/public/discuss…
We hold free, public Data Discussions on Tues evenings.
And general COVID Q&A/kitchen table discussions on Wed evenings.
#StrongerTogether
covid19resources.ca/public/discuss…
• • •
Missing some Tweet in this thread? You can try to
force a refresh