"VOLUME is the ultimate Trading cheat code" PART 2
Please read the FIRST Thread Before Reading this!
#StockMarket #stock #volumeintrading
Please read the FIRST Thread Before Reading this!
https://twitter.com/indraziths/status/1555790060196614144?s=20&t=2KTr2Fru-_QhkvhfYq2rjA
#StockMarket #stock #volumeintrading
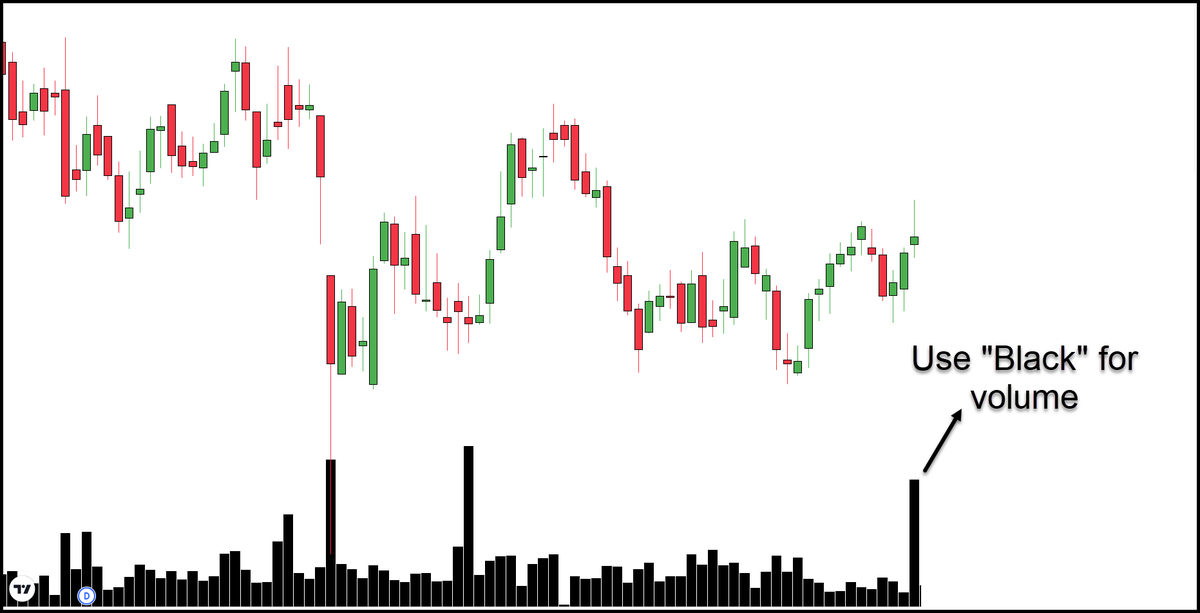
#1 Volume Color Can Create a False Illusion
At first look, it looks like a big volume spike.
But if you notice the price candle, it has a big selling wick.
It indicates "SELLING PRESSURE" is high at that time.
At first look, it looks like a big volume spike.
But if you notice the price candle, it has a big selling wick.
It indicates "SELLING PRESSURE" is high at that time.

We can easily avoid this false impression using the "BLACK" color code across all the volume bars.
Now your mind doesn't assume it is a bullish volume spike!
(If you don't want to use the black color, then view the chart without getting any bias based on the volume color)
Now your mind doesn't assume it is a bullish volume spike!
(If you don't want to use the black color, then view the chart without getting any bias based on the volume color)

#2 Analyze Each Volume Spike Carefully
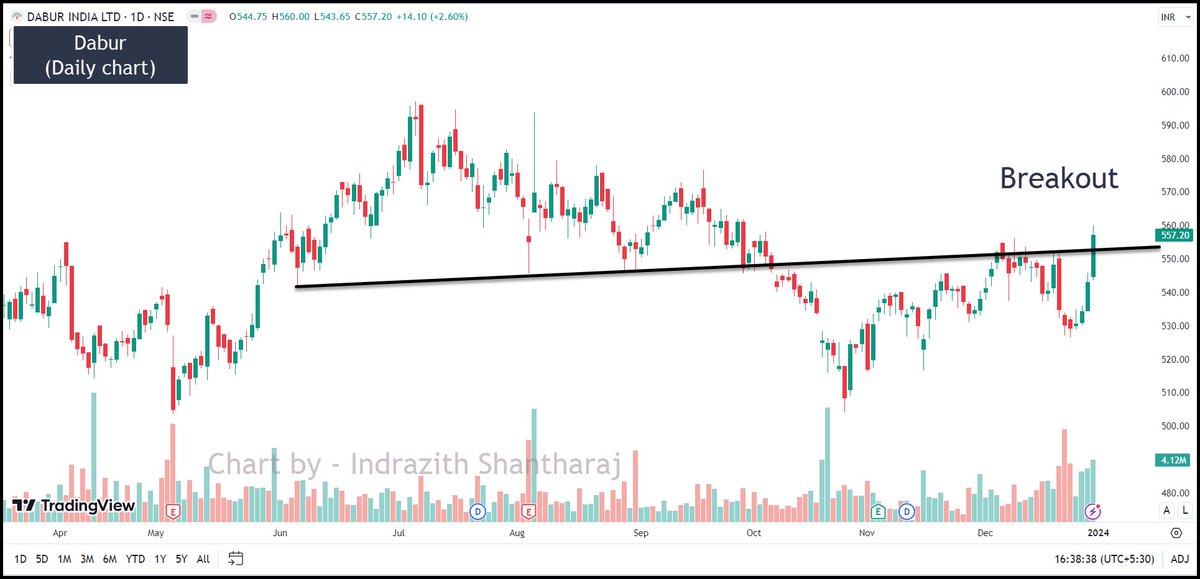
In this image, the price is breaking the resistance trendline.
How do you say whether it is a genuine breakout or false breakout (from a volume perspective)?
In this image, the price is breaking the resistance trendline.
How do you say whether it is a genuine breakout or false breakout (from a volume perspective)?

Observe the major Volume Spikes.
A is Bullish (Price moved upside on the next day)
B is Bearish (Price fell on the next day)
C is Bearish (Price moved sideways and fell)
D is Bearish (Price fell on the next day)
So High Probability of FALSE BREAKOUT!
A is Bullish (Price moved upside on the next day)
B is Bearish (Price fell on the next day)
C is Bearish (Price moved sideways and fell)
D is Bearish (Price fell on the next day)
So High Probability of FALSE BREAKOUT!

One More Example.
How to know whether the price takes support at this trend line and bounces back?
I know price action traders can say it by observing the price itself. But it is better to get double confirmation from "volume."
How to know whether the price takes support at this trend line and bounces back?
I know price action traders can say it by observing the price itself. But it is better to get double confirmation from "volume."

Let's check the major volume spikes.
'A' is Bearish (the price fell on the next day and also a big selling wick on the next day candle)
'B' is Bullish (as the price moved up on the next day)
'A' is Bearish (the price fell on the next day and also a big selling wick on the next day candle)
'B' is Bullish (as the price moved up on the next day)

'C' is Bearish (C candle itself has a selling wick & price didn't move upside on the next day)
'D' is either Neutral or Bearish (price didn't move up on the next day and also has a selling wick)
'E' is Bearish
So there is a high probability of BREAKING THE SUPPORT!
'D' is either Neutral or Bearish (price didn't move up on the next day and also has a selling wick)
'E' is Bearish
So there is a high probability of BREAKING THE SUPPORT!

Below is the result!
Still, this is not 100% perfect as we don't analyze all the volume bars.
But it is far better than traditional volume analysis.
Still, this is not 100% perfect as we don't analyze all the volume bars.
But it is far better than traditional volume analysis.

#3 Don't Depend Much on Volume in Lower Timeframes
Below is Banknifty Futures 3-min Chart on 4/08/2022
It appears like the Bears were in control earlier, and now the market is ready to fall further.
Isn't it?
Below is Banknifty Futures 3-min Chart on 4/08/2022
It appears like the Bears were in control earlier, and now the market is ready to fall further.
Isn't it?

But have a look at the same chart on 15-min Timeframe.
Do you realize you were ready to short at the bottom of the swing?
Also, check how the volume color created an impression in your mind.
Do you realize you were ready to short at the bottom of the swing?
Also, check how the volume color created an impression in your mind.

#4 Use 'Volume Profile' or 'Order Flow' in lower timeframes
Volume Profile displays the volume details in different price levels.
It means the VP shows volume details from a price perspective.
Hence it is for a trader to identify where the largest trading has occurred.
Volume Profile displays the volume details in different price levels.
It means the VP shows volume details from a price perspective.
Hence it is for a trader to identify where the largest trading has occurred.
# Volume Profile
Observe the Nifty chart on the 11th & 12th of August
The highest volume came at 17705
So, on the next trading day, this level automatically acts as 'support' or 'resistance.'
Bcz many people jump to take a trade when the price reaches this level.
Observe the Nifty chart on the 11th & 12th of August
The highest volume came at 17705
So, on the next trading day, this level automatically acts as 'support' or 'resistance.'
Bcz many people jump to take a trade when the price reaches this level.

# Order Flow
Order flow is a footprint chart showing only the real-time market order executed trades to study the momentum and strength of the aggressive buyers and aggressive sellers.
Order flow is a footprint chart showing only the real-time market order executed trades to study the momentum and strength of the aggressive buyers and aggressive sellers.

If the market buy order is hit, then the OFA is printed on the buy side where the seller had a limit order, and if the market sell order is hit, then the OFA is printed on the sell side where the buyer had a limit order.
A limit order during its execution will get converted into a market order when the price reaches the limit level.
For example, if the price of a Stock is 1000, if you keep a Limit Sell order at 1005 when the price reaches 1005, then this limit order will be converted into a market order, and it will be released into the system
An order flow chart will include all the executed market orders
An order flow chart will include all the executed market orders
Useful Terms in Order Flow:
Ask – It is the total ‘Ask’ quantity for the selected time across the price range
Bid – It is the total ‘Bid’ quantity executed at market rates for the selected time across the price range
Ask – It is the total ‘Ask’ quantity for the selected time across the price range
Bid – It is the total ‘Bid’ quantity executed at market rates for the selected time across the price range
Delta - It is the net difference between the Ask and Bid in that respective time window
Cumulative Delta – the ‘Delta’ of every selected timeframe is added to the current window, and it will be displayed. It is the total volume of market orders traded till that time.
Cumulative Delta – the ‘Delta’ of every selected timeframe is added to the current window, and it will be displayed. It is the total volume of market orders traded till that time.

Successful traders use:
'Volume Profile' to know the important price levels
'Order Flow' to get the confirmation of reversal on those price levels
'Volume Profile' to know the important price levels
'Order Flow' to get the confirmation of reversal on those price levels
This is just a basic introduction to 'Volume Profile' and 'Order Flow'.
One has to study in-depth to use them effectively.
Both charts are available with @gocharting
One has to study in-depth to use them effectively.
Both charts are available with @gocharting
That's a wrap!
If you enjoyed this thread:
1. Follow me
@indraziths
for more threads on trading
2. RT the tweet below to share this thread with your audience
3. You can also check my latest book on intraday trading and options trading
amzn.to/3QGvAjY
If you enjoyed this thread:
1. Follow me
@indraziths
for more threads on trading
2. RT the tweet below to share this thread with your audience
3. You can also check my latest book on intraday trading and options trading
amzn.to/3QGvAjY
• • •
Missing some Tweet in this thread? You can try to
force a refresh


