1/ The S&P is up about 8.5% over the last two-and-a-half weeks and 17.7% from its low. Is this a bear market rally?
A short thread on what's going on in the markets right now 👇
A short thread on what's going on in the markets right now 👇
2/ Two weeks ago I wrote a thread on how things started to change after the FOMC meeting on July 27. The gist was: vol was coming down, breadth was improving, and the market decided that no forward guidance is very bullish. You can read that here:
https://twitter.com/fxmacroguy/status/1553667789927247872
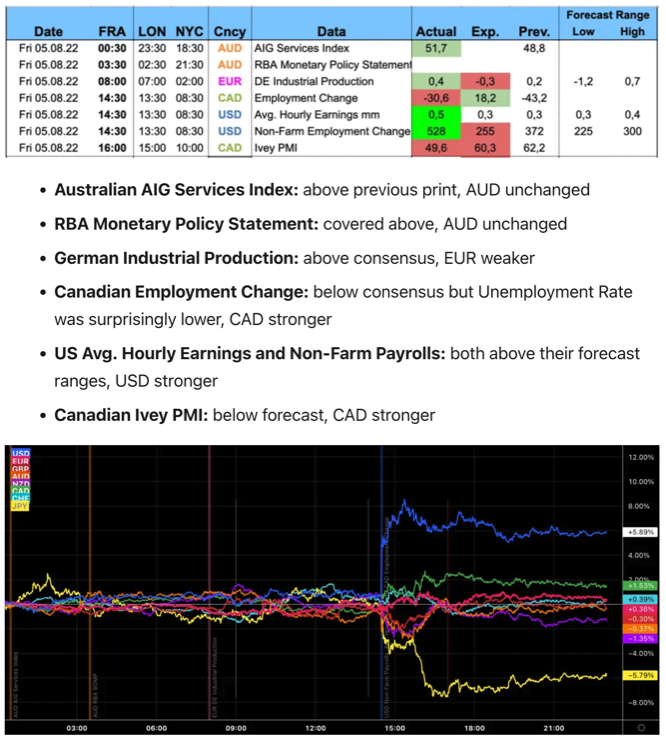
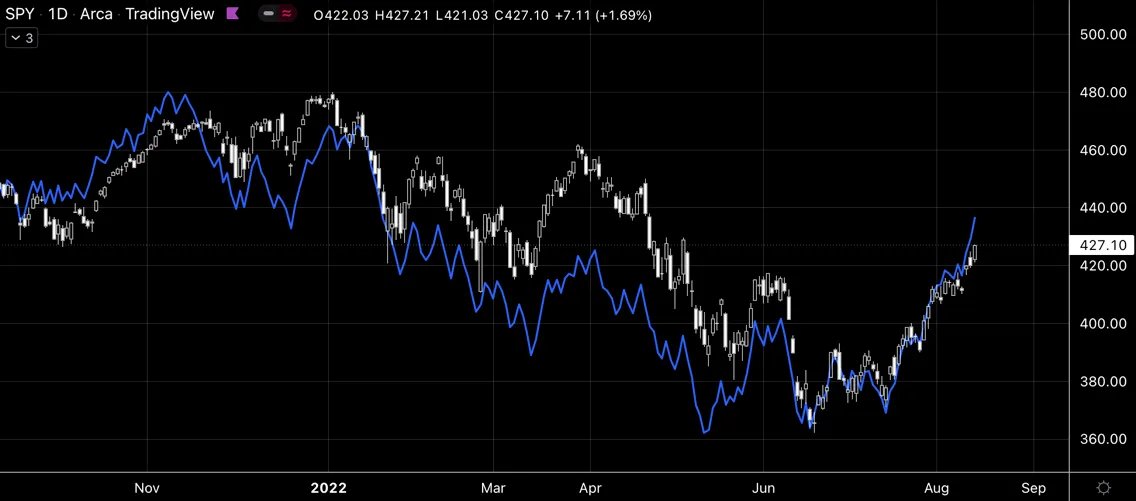
3/ So, how have things turned out so far? Let's start with the data. Last week we've had Non-Farm Payrolls and Average Hourly Earnings both surprise bigly to the upside. The dollar (blue line on the chart) was immediately higher. 
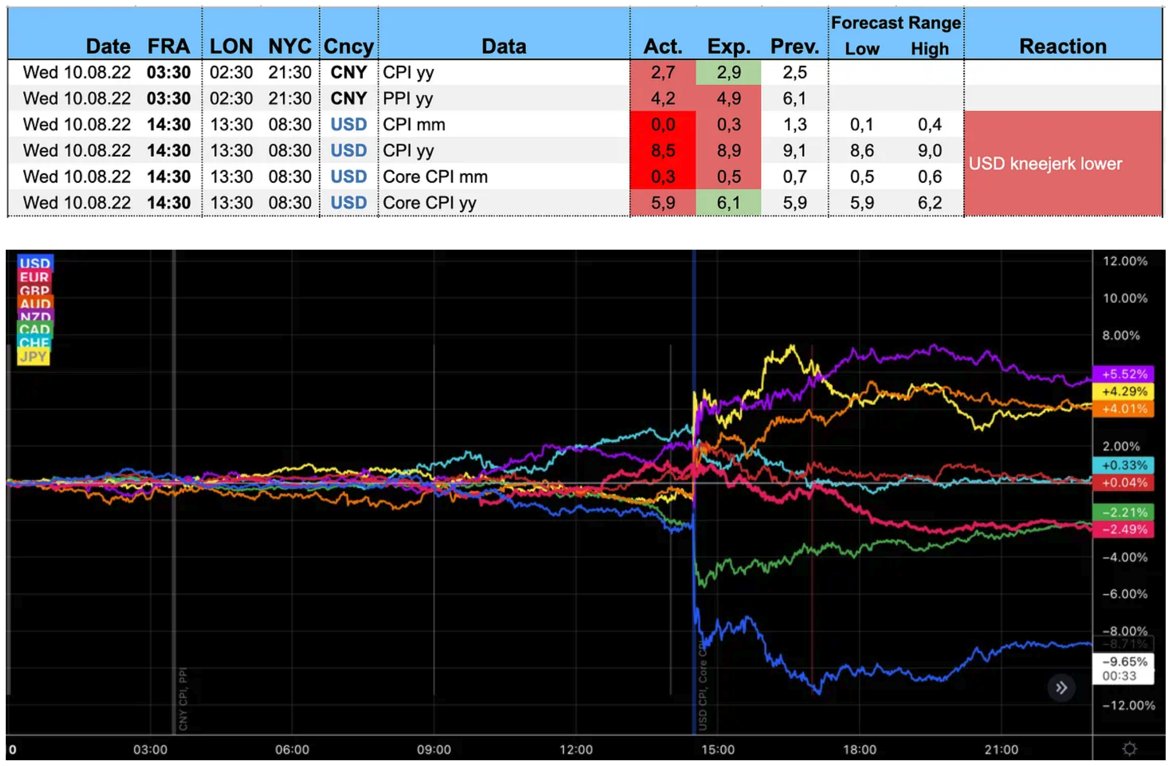
4/ This week on Wednesday CPI cooled with prints even below the range of forecasts. The USD (blue line again) was down sharply. Every tier-1 data point is creating immense moves in the dollar as market participants try to figure out what the Fed is going to do in September. 
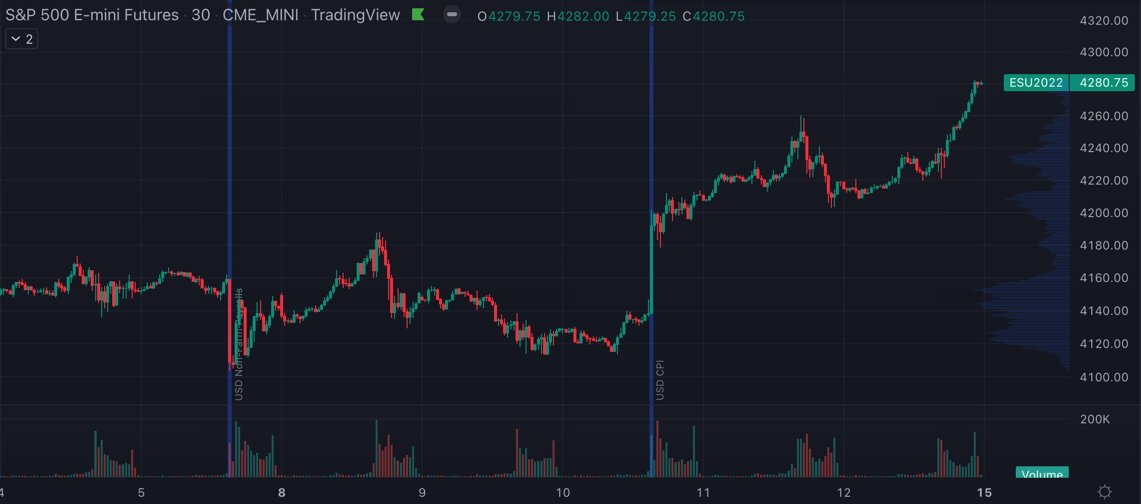
5/ How did the stock market react? It completely ignored the hawkish implication of the Non-Farm Payrolls and loved the dovish impulse from the CPI. That's the market telling you it's just not caring about bad news right now. 
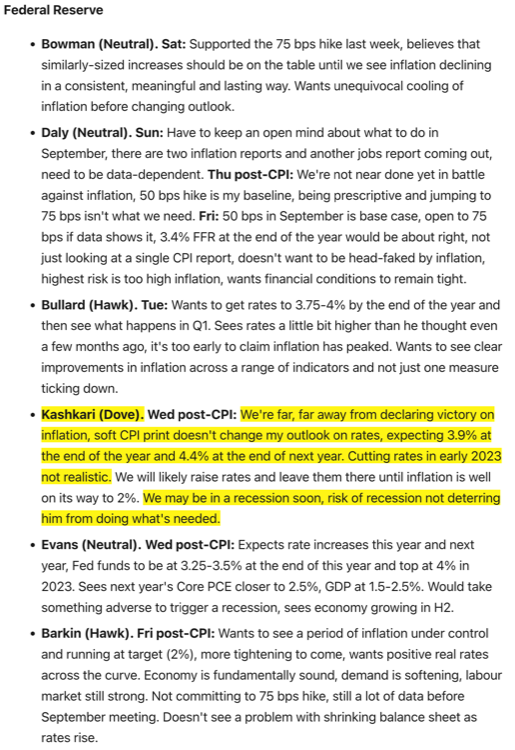
6/ What about Fed speakers? None of them were dovish. In fact, even one of the most dovish members, Neel Kashkari, expects the Fed Funds Rate at almost 4% this year. The Fed is telling us it wants financial conditions tighter, and the S&P rallying is achieving the opposite. 
7/ So, just like the Three Wise Monkeys, market participants ignore don't listen and refuse to see. Don't fight the Fed, right? Well, don't fight the market, either... so, what else is the market telling us?
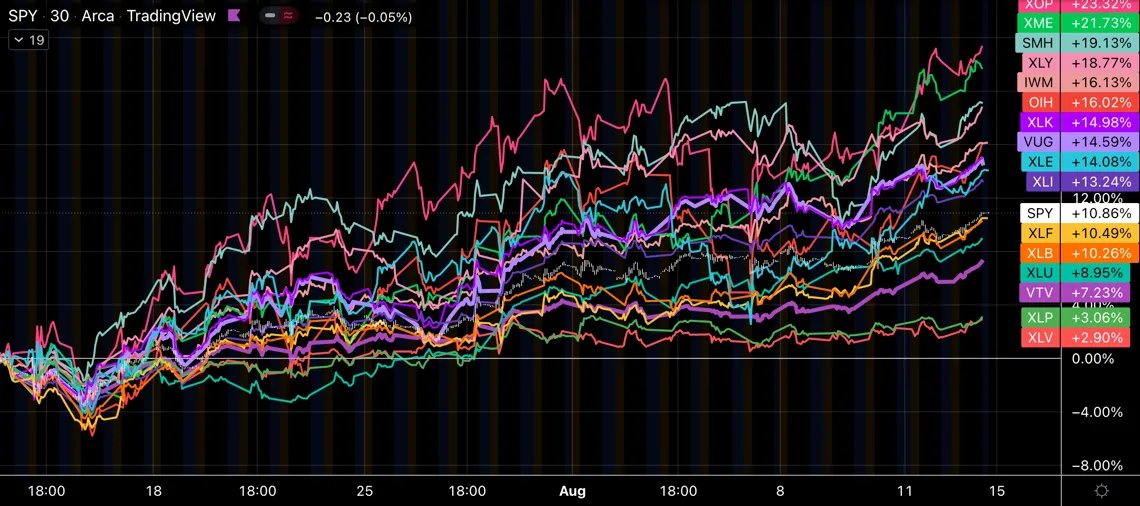
8/ Let's look at equity sectors first. Over one month, offensive and reflationary sectors are up: Semis, Metals, Oil and Gas, Consumer Discretionary. And defensive sectors are behind: Healthcare, Staples, Utilities. 
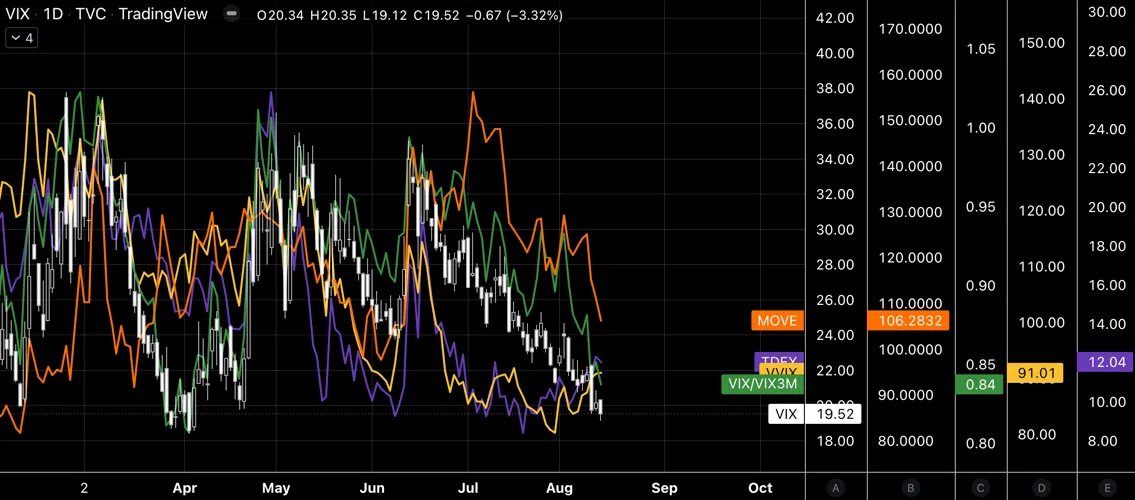
9/ Next, volatility. Bond vol as in MOVE is coming down, the VIX is back below 20, term structure as in VIX/VIX3M is steepening, VVIX is lower. Volatility has a very clear opinion about this market. 
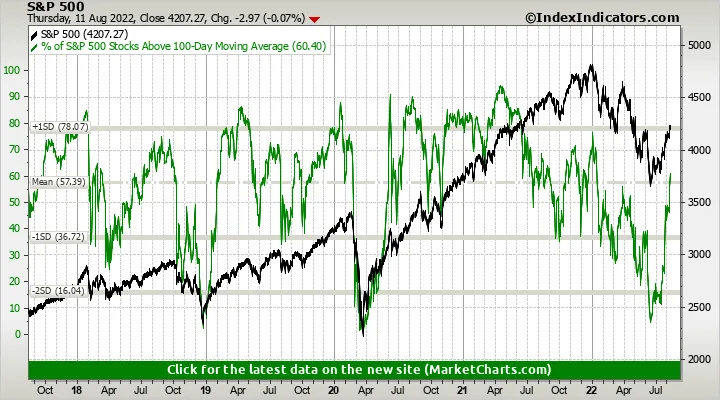
10/ Next, breadth. The NYSE Advance/Decline Line is making new highs. The number of stocks in the S&P above their 100-day moving averages is up sharply as well. This is a pretty sound move, just compare the current dynamics with previous rallies in this bear market. 

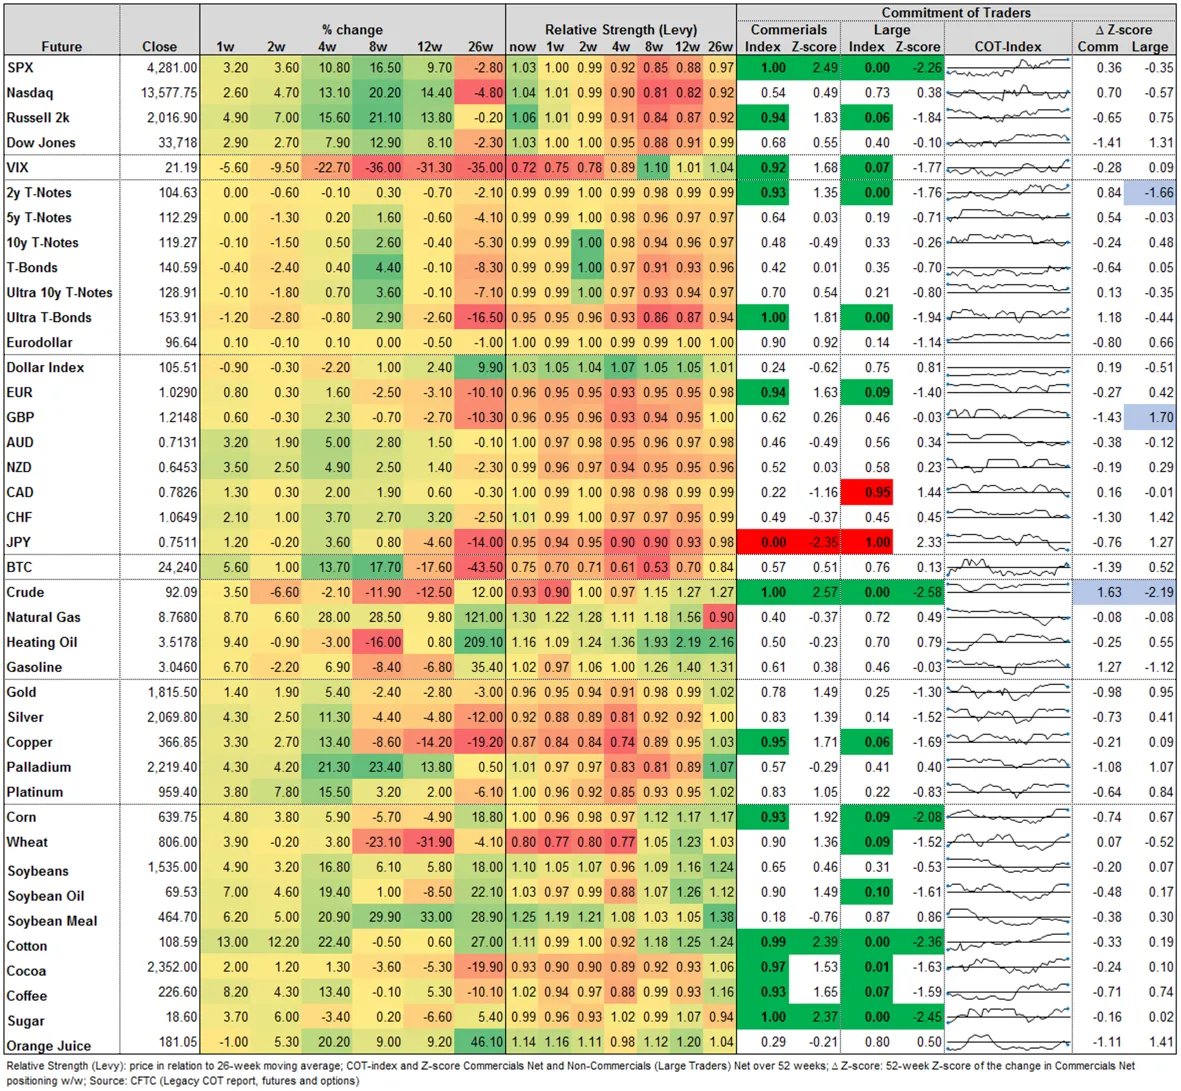
11/ Finally, let's have a look at positioning in the Commitment of Traders report. Commercials and Large Traders are at one-year extremes of their net positions, Commercials on the long, Large Traders on the short side. (Also, #fintwit is very bearish...) These are bullish signs. 
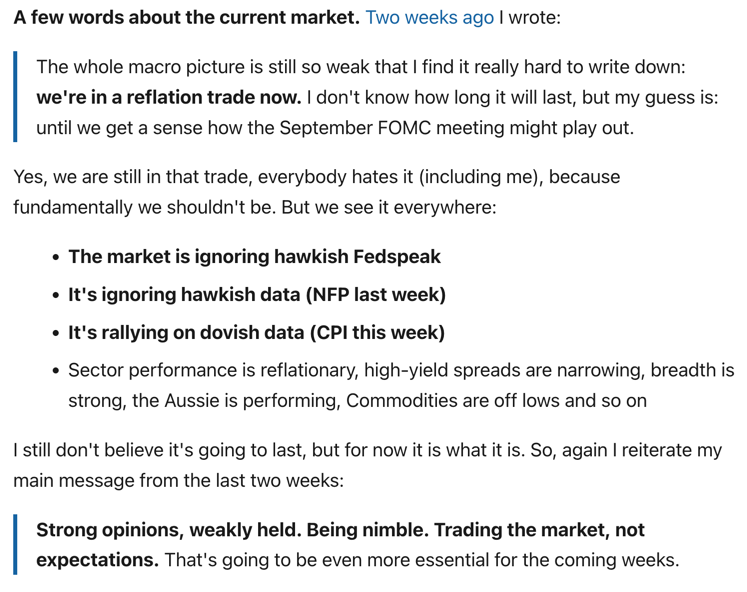
12/ So, what does it all mean? The market is stronger than I expected, and it doesn't pay to go against this strength for now. Here's my summary: 
13/ If you want to receive an analysis like this in your inbox every weekend, you can subscribe to my FX and Macro newsletter. It features a ton of charts and useful information. Check it out, it's free!
fxmacro.info/p/fx-and-macro…
fxmacro.info/p/fx-and-macro…
14/ I hope you've found this thread helpful.
Follow me @fxmacroguy for more.
Like/Retweet the first tweet below if you can:
Follow me @fxmacroguy for more.
Like/Retweet the first tweet below if you can:
https://twitter.com/fxmacroguy/status/1558503706517127169
• • •
Missing some Tweet in this thread? You can try to
force a refresh


