Updated our PADD1/PADD3 mass balances for the quiet hurricane season so far & for scheduled maintenance. Medium-term drop in USG exports from P3 demand, net capacity reductions & more sustainable utilisations & yields, but also from critical PADD1 requirements. #tankers#oott
The trade press loves running apocalyptic headlines on the low gasoil inventories in PADD1 and elsewhere, but the market needs to adjust to lower stocks and just get over their 5-yr averages. Still, just to keep stocks stable in PADD1 this Autumn & Winter…
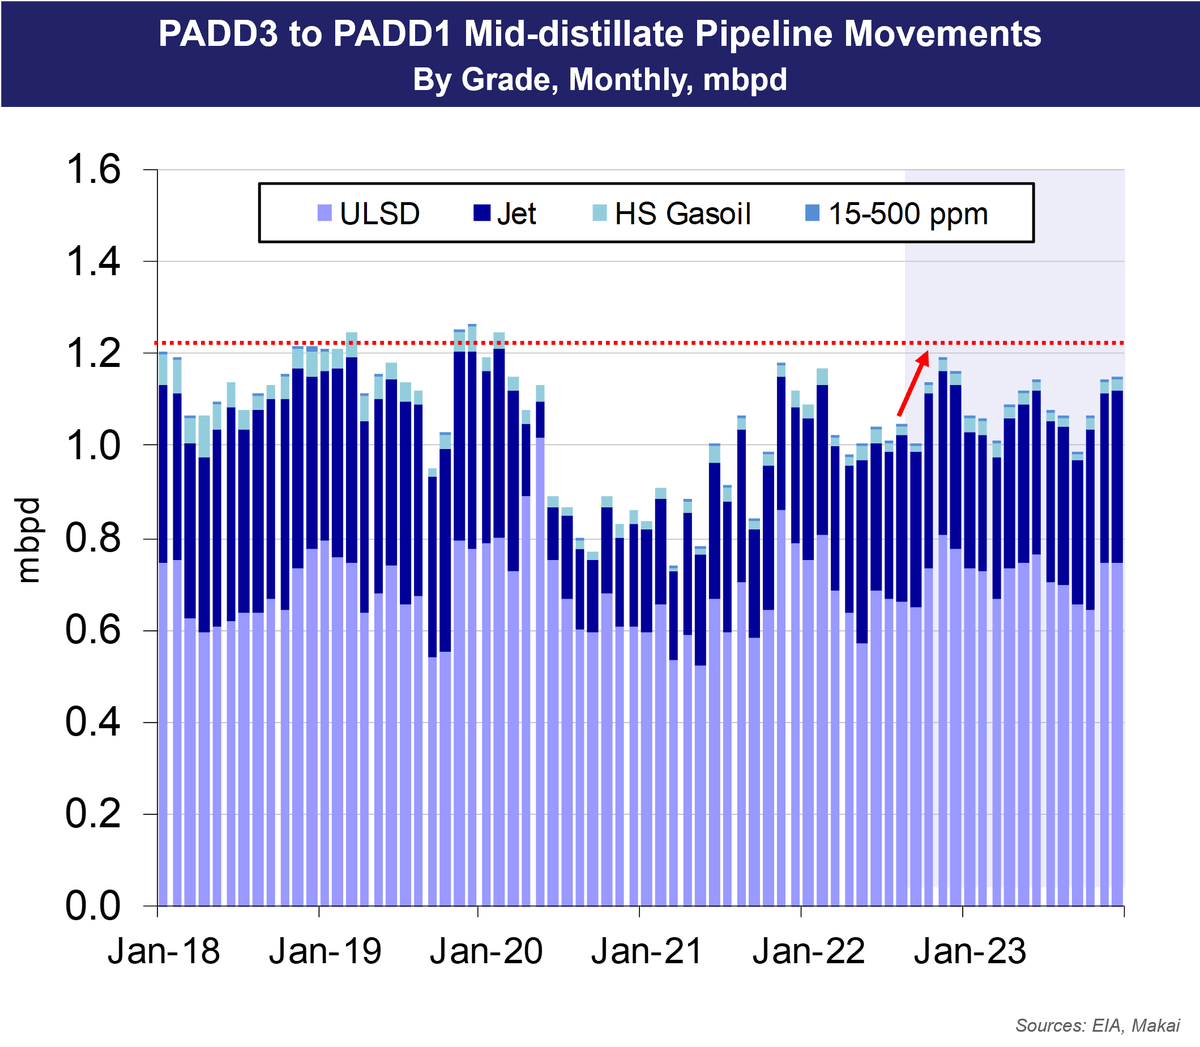
PADD1 will need to draw higher pipeline flows of mid-distillate from PADD3, amidst a tighter seaborne export market. Note the 200 kbpd jump from Summer levels.
PADD3 refineries have been running at extraordinary utilisations this summer, but 600-800 kbpd of seasonal maintenance beckons. Forecast utilisations reflect this maintenance, but only a median hurricane season.
Lower output, higher regional demand and PADD3 stock building would trim potential outflows from PADD3, with higher PADD1 needs cutting into export availability. This excludes any near-term outflow impact from Whiting shutdown or US oil policy errors.
• • •
Missing some Tweet in this thread? You can try to
force a refresh
🧵 This chart reflects what happened in the AG VLCC market last week, as owners withheld vessels and stopped offering into AG cargoes, on regional threats. VL earnings doubled, as the supply curve shifted left against an inelastic demand curve.
#oott #tankers $FRO $DHT $INSW $ECO $TNK $TEN
Not to be confused with what typically occurs when earnings double. More often than not, it is from an increase in demand and the rightward shift in the demand curve (with some supply assist).
This is not what is happening, as the near-term oil demand and refining fundamentals remain the same, absent any crisis events. The curves D0 and S0 remain a closer representation of the VL market balance without any geopolitical drama.
So now what, following the US bombing? You would argue that owners will withdraw more vessels from the market and be even less responsive to potential cargoes, shifting the curve further to the left. The chart is purely illustrative, and not a forecast, but shows how much earnings can jump, against that inelastic demand curve.
🧵 We had no idea there was only “one” correct VLCC earnings seasonality chart, when in fact, these charts are a deeply-flawed approach to “predicting” winter earnings. Freight is a derived demand, and so…
#oott #tankers $FRO $DHT $INSW $ECO
…any “freight seasonality” actually derives from the seasonality of the oil fundamentals – product demand, crude runs & utilisation, crude/NGL supply & inventories – which can vary significantly from year to year.
Any tanker-specific winter seasonality comes from slower speeds (rougher sea conditions), port delays, Bosphorus delays from shorter daylight & fog, and other winter environmental conditions. These can reduce fleet productivity by 2-3%, which can be worth $10-20k/day.
This is the product tanker investment hypothesis in its entirety -- replacing Russian gasoil from further sources, sending utilisations to 99% and earnings to $250k/day. By now, it has become an unquestioned mantra in the market. One small problem… #tankers $ASC $HAFNI $STNG
When we constructed our European recession scenario a few months ago, with a 3% decline in 2023 real GDP, we felt a bit extreme. We later trimmed it to -2.6%, but now feeling this might be too sanguine. Weak Case sees an extended downturn à la BoE.
This chart is the same in every country, with road diesel showing strong income elasticity. In Europe's case, diesel shortages & high prices may be limiting industrial production and pressuring GDP, as well as the traditional mechanism.
The problem with this assessment of the OPEC+ cuts, & the tanker commentary that you post, is the sticky assumption that oil demand will grow 2.1 mbpd next year, per the IEA latest. This is nonsense, and with tomorrow’s IMF WEO release, this is “should” start to change. #tankers
We have argued that retail tanker longs are disadvantaged by listening to shipbroker & sell side analysts, who do not have the analytical tools & large datasets to convert alternative macro outlooks into new oil & tanker demand forecasts, amidst lagged demand data.
Both the IMF & IEA are hopeless at economic inflection points, like where we have been this year, and unfortunately, both shipbrokers & the sell side are reliant on the IEA outlooks, who in turn, are driven by the slow-moving IMF.