Happy #JobsDay.
At 8:30 am ET @BLS_gov delivers the most-important signals abt how economy is changing.
Forecasts’ center:
+318K jobs
Steady at 3.5% unemployment rate
At 8:30 am ET @BLS_gov delivers the most-important signals abt how economy is changing.
Forecasts’ center:
+318K jobs
Steady at 3.5% unemployment rate
Biggest question in economy:
How quickly can we raise supply? Keep global communities healthy & vibrant. Bring more labor & capital to production & boost productivity. Success means more consumption & lower prices.
Failure means painful demand reductions via Fed.
How quickly can we raise supply? Keep global communities healthy & vibrant. Bring more labor & capital to production & boost productivity. Success means more consumption & lower prices.
Failure means painful demand reductions via Fed.
Increased supply comes if employers improve jobs fast enough to attract people they say they want to hire off sidelines.
Since pre-pandemic, corporate profit margins grew 35%, much faster than prices (+13%) or private-sector hourly labor costs (+10%).
Since pre-pandemic, corporate profit margins grew 35%, much faster than prices (+13%) or private-sector hourly labor costs (+10%).
https://twitter.com/aaronsojourner/status/1562818171140440064
The Employment Situation report will be here
bls.gov/news.release/e…
bls.gov/news.release/e…
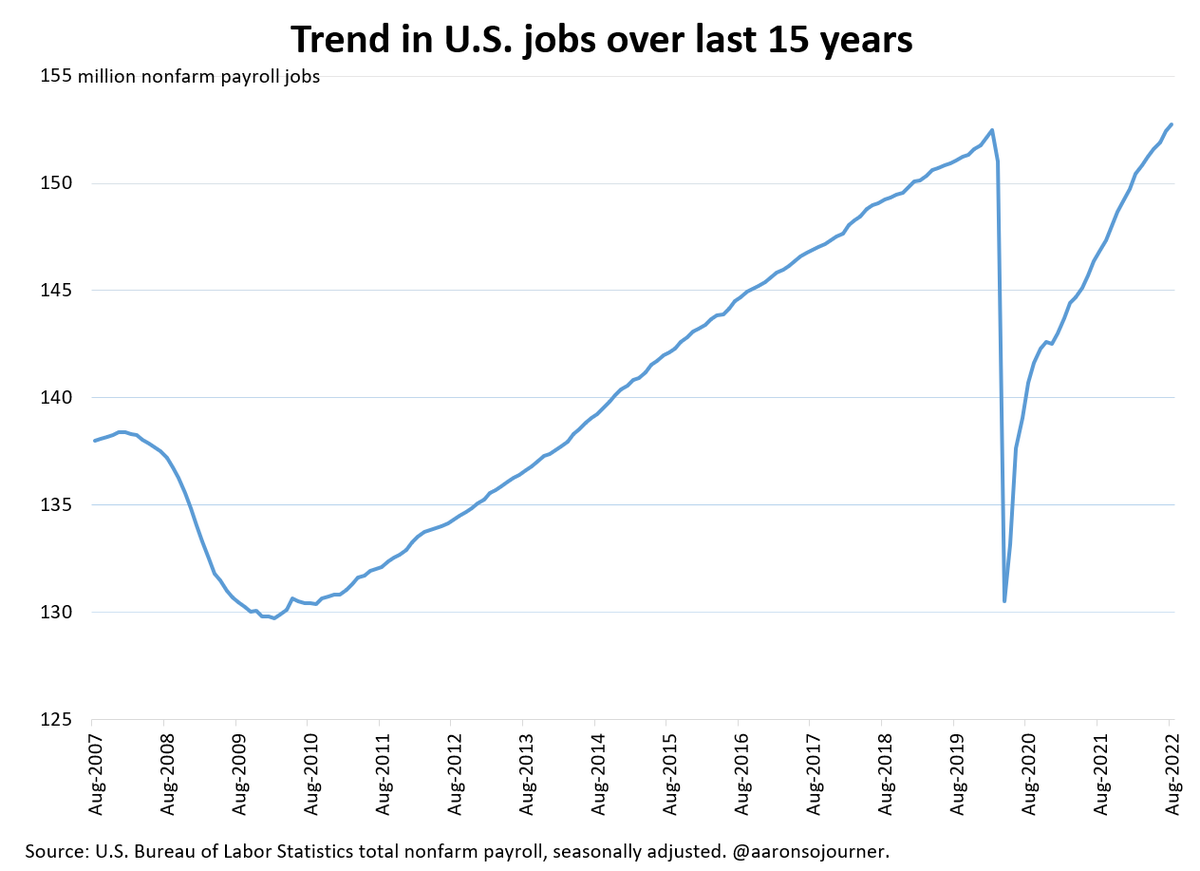
315K jobs gained last month (mid-July to mid-Aug).
-107K jobs in revisions of last 2 months
Built on last month's push ahead of pre-pandemic job levels but still way behind pre-pandemic forecasts.
-107K jobs in revisions of last 2 months
Built on last month's push ahead of pre-pandemic job levels but still way behind pre-pandemic forecasts.

How does recent growth compare to recent years?
Economy added 5.84 million jobs over 12 months to Aug 2022. Strong growth trend continues though some deceleration clear.
Still very strong relative to pre-pandemic history.
Economy added 5.84 million jobs over 12 months to Aug 2022. Strong growth trend continues though some deceleration clear.
Still very strong relative to pre-pandemic history.

Job growth has decelerated a smidge and this is likely to continue:
487K/mo over most-recent 12 months
381K/mo over most-recent 6 months
378K/mo over most-recent 3 months
315K this past month
487K/mo over most-recent 12 months
381K/mo over most-recent 6 months
378K/mo over most-recent 3 months
315K this past month

Fiscal policy at all gov't levels created drag on economic growth by -3.3 pp in annualized terms in 2022Q3, per @BrookingsInst.
Monetary policy at Fed also shifting to create drag on growth.
brookings.edu/interactives/h…
Monetary policy at Fed also shifting to create drag on growth.
brookings.edu/interactives/h…

@BrookingsInst Unemployment rate rose to 3.7% from 3.5%.
Rises can happen for "good" reasons (more people who were out the labor force start searching for a job than before) or "bad" (fewer jobseekers find jobs).
It's mostly good reasons.
Bad: U->U and E->U up 42K and 6K
Good: N->U up 295K
Rises can happen for "good" reasons (more people who were out the labor force start searching for a job than before) or "bad" (fewer jobseekers find jobs).
It's mostly good reasons.
Bad: U->U and E->U up 42K and 6K
Good: N->U up 295K

@BrookingsInst The labor force participation rate increased by 0.3 percentage point (pp) over the month to 62.4% but is 1.0 pp below its February 2020 level.
The employment-population ratio (EPOP), share of adults employed, little changed at 60.1% = 1.1 pp below its February 2020 value.
The employment-population ratio (EPOP), share of adults employed, little changed at 60.1% = 1.1 pp below its February 2020 value.

Prime age (25-54 years old) employment to population ratio is an important measure of core labor market strength, omits people on the fringes of work.
A strong 0.3 pp rise in August follows July's 0.2 rise, breaking prior stall. Great news.
A strong 0.3 pp rise in August follows July's 0.2 rise, breaking prior stall. Great news.

Look at change in the shares of population employed by narrow age groups since pre-pandemic.
The biggest rate drops are among the oldest Americans. More accelerated late retirements than "early" retirements. But these oldest groups are small.
Up only for youngest.
The biggest rate drops are among the oldest Americans. More accelerated late retirements than "early" retirements. But these oldest groups are small.
Up only for youngest.

Employment rate for those with at least a bachelors has almost fully recovered. But those with less education are driving the employment gap.
Long COVID could be a part of this, as Americans with less education were hit hardest by the virus.
Long COVID could be a part of this, as Americans with less education were hit hardest by the virus.

Employment rates by race, ethnicity and gender show a mixed story.
The 3 groups estimated to have the largest employment rate gaps versus pre-pandemic are:
Black women,
Hispanic men, and
White men.
Employment among Asian Americans is above pre-pandemic level.
The 3 groups estimated to have the largest employment rate gaps versus pre-pandemic are:
Black women,
Hispanic men, and
White men.
Employment among Asian Americans is above pre-pandemic level.

That’s the extensive quantity (Q) margin. Intensive Q margin is average hours.
Avg workweek hours for private sector ticked down 0.1 hour to 34.5 hrs.
Normalizing after employers worked staff longer in pandemic, to avoid offering raises to hire.
Hiring eases hrs, will slow.
Avg workweek hours for private sector ticked down 0.1 hour to 34.5 hrs.
Normalizing after employers worked staff longer in pandemic, to avoid offering raises to hire.
Hiring eases hrs, will slow.

Positive signal from temporary help sector, the most flexible part of employment & leading indicator of recession.
+11.6K this month, up from 8.5K & 6.5K in prior 2.
Keep your eye on it. Big percentage point drops over the year before recent recessions. This ain't it.
+11.6K this month, up from 8.5K & 6.5K in prior 2.
Keep your eye on it. Big percentage point drops over the year before recent recessions. This ain't it.
In sum,
- another strong job growth month
- people entering labor force, especially prime-age
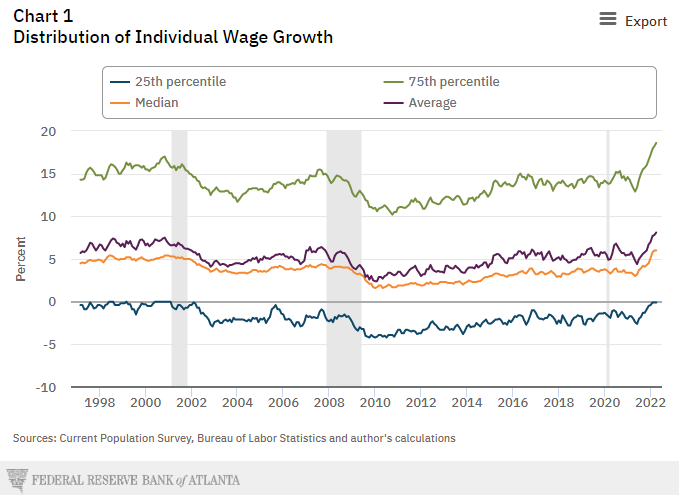
- wage growth at 5.2% over year slower than price inflation & well behind growth in corporate profit margins
- asset holders have largely paid to slow inflation, workers less so far.
- another strong job growth month
- people entering labor force, especially prime-age
- wage growth at 5.2% over year slower than price inflation & well behind growth in corporate profit margins
- asset holders have largely paid to slow inflation, workers less so far.
Doing this at noon ET. Tune in!
https://twitter.com/eleanor_mueller/status/1564680502040477696
Last thing. @BLS_gov does amazing work to create timely, accurate info about America's working families, a huge public good.
They are there for us & we need to show up for them. If you are a labor economist or care about workers & employment, follow & join @Friends_of_BLS.
They are there for us & we need to show up for them. If you are a labor economist or care about workers & employment, follow & join @Friends_of_BLS.
Employed Americans who missed an entire week of work due to:
1) own illness, injury, or health problem,
2) child care problems, or
3) other family or personal obligation
surged 54% during pandemic, from 1.24M to avg 1.90M.
#JobsReport estimates what happened in August.
1) own illness, injury, or health problem,
2) child care problems, or
3) other family or personal obligation
surged 54% during pandemic, from 1.24M to avg 1.90M.
#JobsReport estimates what happened in August.

In August, weekly, an extra 0.4% of employed Americans were absent for at least an entire week for one of these reasons, continuing recent months' rise.
This adjusts for typical monthly levels & linear trend pre-pandemic, smooths w/3 month moving average & puts as % of employed.
This adjusts for typical monthly levels & linear trend pre-pandemic, smooths w/3 month moving average & puts as % of employed.

• • •
Missing some Tweet in this thread? You can try to
force a refresh


