In 2021, there were 5,583 suicides registered in England and Wales ow.ly/hLLV50KALpW Line chart showing suicide rates registered in 2021 are simi
James Tucker, Head of Analysis in the Health and Life Events Division, Office for National Statistics, said: (1/2)

⬇️

#WorldSuicidePreventionDay  We saw a significant increase in the rate of deaths registe
James Tucker continued by saying: (2/2)

⬇️ The 2021 suicide rate was similar to the pre-pandemic rates
Around three-quarters of suicides were males (4,129 deaths, 16.0 deaths per 100,000) this is consistent with long-tern trends.

Since 2010, men aged 45 to 64 years have had the highest age-specific suicide rates. In 2021, the rate in this group was 20.1 deaths per 100,000. Line chart showing men aged 45 to 64 years have had the high
In 2021, the age-specific suicide rate among females was highest in those aged 45 to 49 years, a rate of 7.8 deaths per 100,000 (146 registered deaths).

Females aged 24 years and under has seen the largest increase in the suicide rate since our time series began in 1981. Line chart showing suicide rates among females aged 45 years
London has had the lowest suicide rate of any English region in 10 of the last 11 years, a rate of 6.6 deaths per 100,000,

In 2021, the highest rate was in the North East (14.1 deaths per 100,000).

In Wales, there were 12.7 deaths per 100,000 people (347 registered deaths). Map of England and Wales and bar chart showing the North Eas
We’ve also published new provisional data on quarterly suicide death registrations in England for Quarter 1 (Jan to Mar) to Quarter 2 (Apr to June) 2022 ow.ly/BpZP50KALKa
If you are struggling to cope, call @samaritans free on 116 123 (UK and ROI), email jo@samaritans.org, or visit the Samaritans website to find details of the nearest branch.

Resources are also available on the NHS help for suicidal thoughts webpage
ow.ly/Thtr50KxT5t

• • •

Missing some Tweet in this thread? You can try to force a refresh
 

Keep Current with Office for National Statistics (ONS)

Office for National Statistics (ONS) Profile picture

Stay in touch and get notified when new unrolls are available from this author!

Read all threads

This Thread may be Removed Anytime!

PDF

Twitter may remove this content at anytime! Save it as PDF for later use!

Try unrolling a thread yourself!

how to unroll video
  1. Follow @ThreadReaderApp to mention us!

  2. From a Twitter thread mention us with a keyword "unroll"
@threadreaderapp unroll

Practice here first or read more on our help page!

More from @ONS

Sep 6
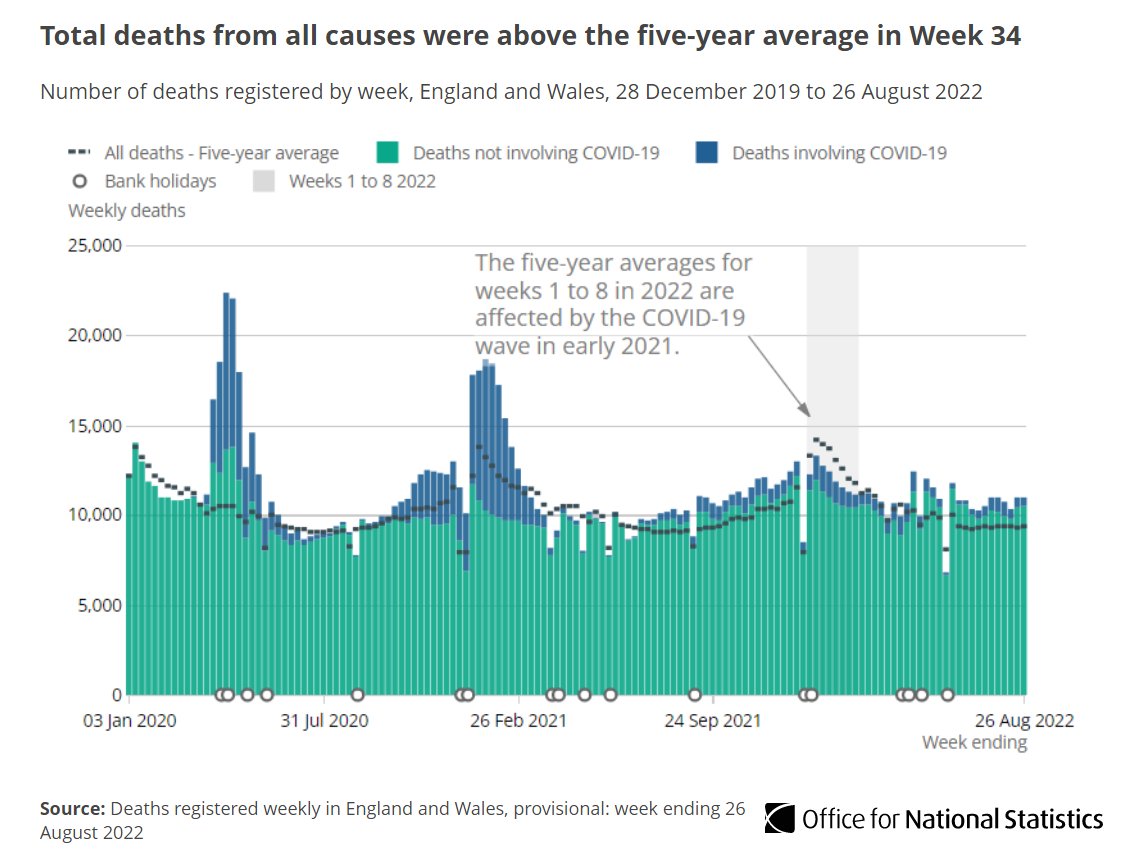
10,942 deaths were registered in England and Wales in the week ending 26 August 2022 (Week 34). This was 16.6% above the five-year average (1,556 excess deaths) ow.ly/5iSQ50KAKRV Stacked bar and line chart showing total deaths from all cau
453 of the deaths in Week 34 mentioned #COVID19 on the death certificate, accounting for 4.1% of all deaths.

62.3% (282) of these 453 deaths had #COVID19 recorded as the underlying cause of death. This is a decrease from 64.2% in Week 33.
The number of deaths in England and Wales in Week 34 was above the five-year average in:
▪️ private homes (28.2% above, 667 excess deaths)
▪️ hospitals (13.9% above, 586 excess deaths)
▪️ care homes (13.7% above, 275 excess deaths)
Read 4 tweets
Sep 5
Today we’ve published an article looking at broader measures of labour market availability and indicators of mismatch between unemployment and vacancies across industries ow.ly/I5Hn50KA2a1
In recent quarters, UK unemployment has fallen to historically low rates while the number of job vacancies has increased to record levels.

This infers the current rate of labour underutilisation (the inability of the economy to generate jobs for those who want to work) is low. Line chart showing the number of vacancies has exceeded the
Broader measures of labour market availability incorporating those marginally attached to the labour force and the underemployed have also fallen to historically low rates.

This provides further evidence of there being relatively little spare capacity. Line chart showing the additional supplies of discouraged an
Read 6 tweets
Aug 23
In July 2022, 42,034 deaths were registered in England and 2,638 deaths were registered in Wales.

Mortality rates for July 2022 were higher compared with July 2021, but changes were not significant ow.ly/ssX650Kq0qB Line chart showing Mortality rates for July 2022 were higher
In England, the number of deaths were

▪️ 10.2% higher than the July five-year average (2016 to 2019, and 2021)
▪️ 11.8 % higher than the pre-pandemic five-year average (2015 to 2019).
In Wales the number of deaths were

▪️ 4.3% above the July average (2016 to 2019, and 2021)
▪️ 6.4% higher than the pre-pandemic five-year average (2015 to 2019).
Read 6 tweets
Aug 23
10,355 deaths were registered in England and Wales in the week ending 12 August 2022 (Week 32).

This was 10.1% above the five-year average (950 excess deaths) ow.ly/mHog50Kq0h7 Bar and line chart showing that total deaths from all causes
592 of the deaths in Week 32 mentioned #COVID19 on the death certificate, accounting for 5.7% of all deaths.

60.1% (356) of these 592 deaths had #COVID19 recorded as the underlying cause of death. This is a decrease from 64.9% in Week 31.
The number of deaths in England and Wales in Week 32 was above the five-year average in:

▪️ private homes (21.6% above, 525 excess deaths)
▪️ hospitals (9.0% above, 381 excess deaths)
▪️ care homes (3.1% above, 60 excess deaths).
Read 4 tweets
Aug 22
We've collected data published over the last two weeks relating to the rising #CostofLiving 📈

Around 9 in 10 (89%) adults continued to report their cost of living has risen over the past month (3 to 14 Aug 2022) ow.ly/Glul50Kpnbk Graphic with text: Follow o...
Around three-quarters (76%) of adults reported being very or somewhat worried about rising #CostofLiving in the past two weeks ow.ly/Glul50Kpnbk Graphic with text:  76%   o...
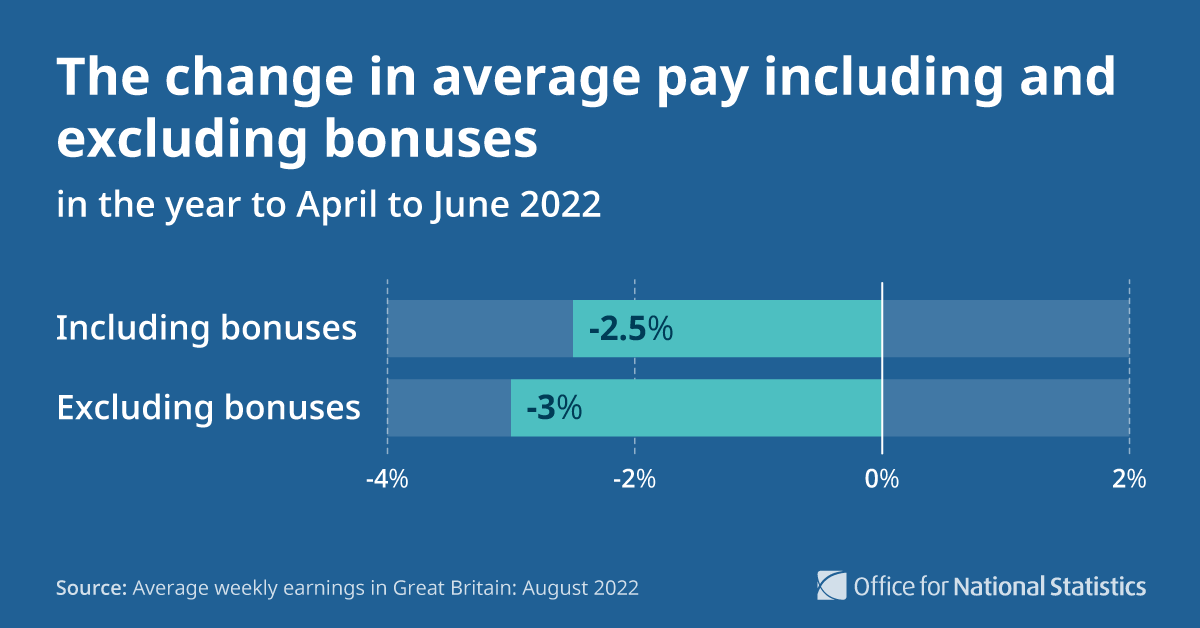
After taking inflation into account, average pay including bonuses fell by 2.5% in the year to April to June 2022.

Excluding bonuses, it fell by 3.0% – the biggest fall since records began in 2001 ow.ly/L4si50KpnfO Bar chart graphic:   Title:...
Read 6 tweets
Aug 2
10,978 deaths were registered in England and Wales in the week ending 22 July 2022. This was 18.1% above the five-year average (1,680 excess deaths).

Of these, 745 mentioned #COVID19 on the death certificate, accounting for 6.8% of all deaths ow.ly/wOCL50K9hyT Bar and line chart showing total deaths from all causes were
Of the 745 deaths involving #COVID19, 62.1% (463 deaths) had this recorded as the underlying cause of death.

This is a decrease from 65.3% in the previous week ow.ly/wOCL50K9hyT
From the week ending 13 March 2020 to the week ending 22 July 2022, the number of excess deaths above the five-year average in England and Wales was 142,761. Of these:

▪️ 136,758 were recorded in England
▪️ 7,277 were recorded in Wales

➡️ ow.ly/wOCL50K9hyT
Read 4 tweets

Did Thread Reader help you today?

Support us! We are indie developers!


This site is made by just two indie developers on a laptop doing marketing, support and development! Read more about the story.

Become a Premium Member ($3/month or $30/year) and get exclusive features!

Become Premium

Don't want to be a Premium member but still want to support us?

Make a small donation by buying us coffee ($5) or help with server cost ($10)

Donate via Paypal

Or Donate anonymously using crypto!

Ethereum

0xfe58350B80634f60Fa6Dc149a72b4DFbc17D341E copy

Bitcoin

3ATGMxNzCUFzxpMCHL5sWSt4DVtS8UqXpi copy

Thank you for your support!

Follow Us on Twitter!

:(