Subhadip Nandy Profile picture
Sep 6, 2022 9 tweets 3 min read Read on X
Image
Showing a simple data analysis, mainly OI/COI analysis to show how I pick up direction from OI. This pic is of COI ( cumulative OI of 3 months added) of BNF. See that huge COI buildup yesterday. OI = net longs = net shorts at end of day. Question is, who is winning ? Image
At close today, prices are
1. below today"s vwap
2. below yesterday's vwap
3. below 1SD of vwap of yesterday
4. below 1SD of vwap of today Image
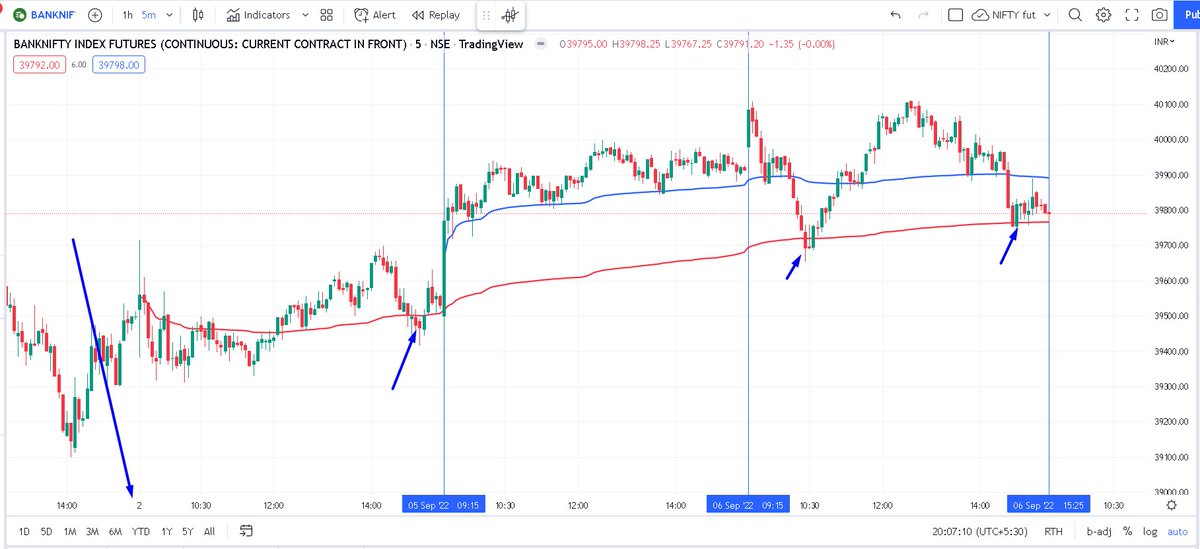
Now I have two anchored VWAPs plotted , an anchored vwap is a vwap which continues from a particular price point. Here we have the RED avwap from start of this weekly expiry, the blue one from yesterday opening ( remember the huge COI addition yesterday) Image
If you see the AVWAP from yesterday morning, the COI which was there now means longs are trapped ( since below avwap, shorters are getting money). If you see the AVWAP of this expiry, we already had 3 tests, generally the next breaks thru this avwap.
Targeting has a logic. Whatever price the instrument went above the avwap, same distance can be achieved on the downside. Which brings the target to 39400.

So, our trade on Sentient was a bear spread :
Buy 39800PE and sell 39400PE, debit=maxloss=160, max profit 240. Image
This was the chart shared with #sentient members at closing after we took the short Image
I also take a view on volatility if I take an overnight position, this is a proprietary logic. The BLUE + signs means VIX expected to go up and RED+ signs means VIX expected to go down Image

• • •

Missing some Tweet in this thread? You can try to force a refresh
 

Keep Current with Subhadip Nandy

Subhadip Nandy Profile picture

Stay in touch and get notified when new unrolls are available from this author!

Read all threads

This Thread may be Removed Anytime!

PDF

Twitter may remove this content at anytime! Save it as PDF for later use!

Try unrolling a thread yourself!

how to unroll video
  1. Follow @ThreadReaderApp to mention us!

  2. From a Twitter thread mention us with a keyword "unroll"
@threadreaderapp unroll

Practice here first or read more on our help page!

More from @SubhadipNandy16

Sep 26
Did not do one of those lengthy technical threads for a long time. So here we go :

Intraday straddle/strangle selling 101 : The basics

( for someone experienced , all these points are known. But facing these simple questions on Twitter, so tried to give a simple overview. If I am wrong in any point or have missed something, please point that out and I will rectify / add )
Intrinsic Value
Intrinsic value is the amount by which an option is in-the-money (ITM). It represents the real, tangible value of the option if it were exercised right now.

🔹For a call option, intrinsic value is calculated as:
Intrinsic Value=Current Stock Price−Strike Price
For example, if the stock price is Rs. 135 and the strike price is 100, the intrinsic value is 35

🔹For a put option, intrinsic value is:
Intrinsic Value=Strike Price−Current Stock Price
If the stock price is Rs.135 and the strike price is 150, the intrinsic value is 15

If an option is out-of-the-money (OTM), its intrinsic value is zero because exercising it would not be profitable
Extrinsic Value
Extrinsic value (also known as time value) is the portion of the option’s price that exceeds its intrinsic value. It accounts for the potential for the option to gain value before expiration due to factors like time remaining and volatility.

Time Value: The longer the time until expiration, the higher the extrinsic value, as there’s more opportunity for the underlying asset’s price to move favorably.

Implied Volatility: Higher volatility increases extrinsic value because there’s a greater chance of significant price movement.
For example, if a call option has an intrinsic value of Rs.15 and is priced at rs.20, the extrinsic value is Rs.5.

Option Price
The total price (premium) of an option is the sum of its intrinsic and extrinsic values:
Option Price=Intrinsic Value + Extrinsic Value
Read 10 tweets
Jun 25
Here is the link for tomorrow :

Will show Nifty and BankNifty charts, best if one sees on a laptop/computer screen to see the layout. Mobile apps seems to show only one chart. Change background to black to see the SL lines.

I will be off markets tomorrow, so cannot answer any queries in realtime.tradingview.com/chart/HpnI5PSs/
Options Analyser analyses the whole option chain and shows Bullish or Bearish. Deep blue bars hitting > 96 is strongly bullish. Deep red bars <-96 are strongly bearish.
Value above 68 bullish , below -68 bearish.

Values between -68 and 68 are neutral/congestion .
Buy or Sell signals gets generated based on AVWAPS, shows entry point and SL .
There is another signal shown and P_Buy or P_Sell. That's a pullback buy or pullback sell , generally much more accurate than a normal buy/sell
Read 10 tweets
Mar 16
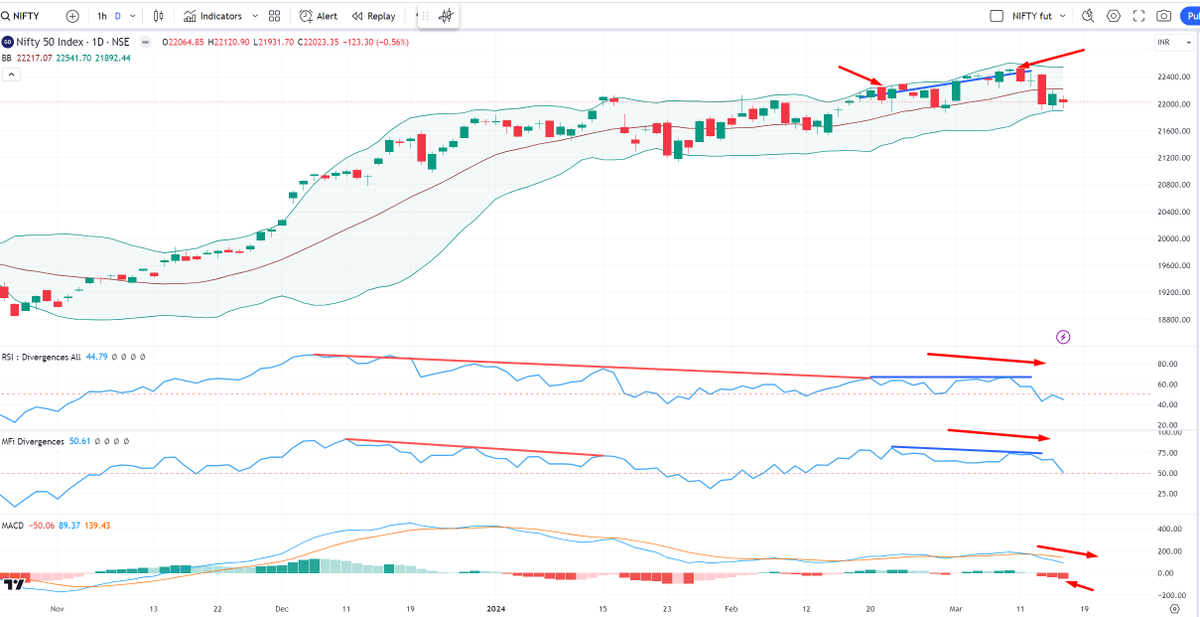
Positional analysis on Nifty. These are just pointers from charts and indicators which should be kept in mind for the rest of this March expiry
Negative divergence on RSI and MFI
Volatility divergence on Bollinger Bands
MACD is sell signal, raw MACD line sloping down Image
Breakdown of trendlines on price supported by breakdown on trendlines of RSI and MFI. Image
Read 8 tweets
Mar 14
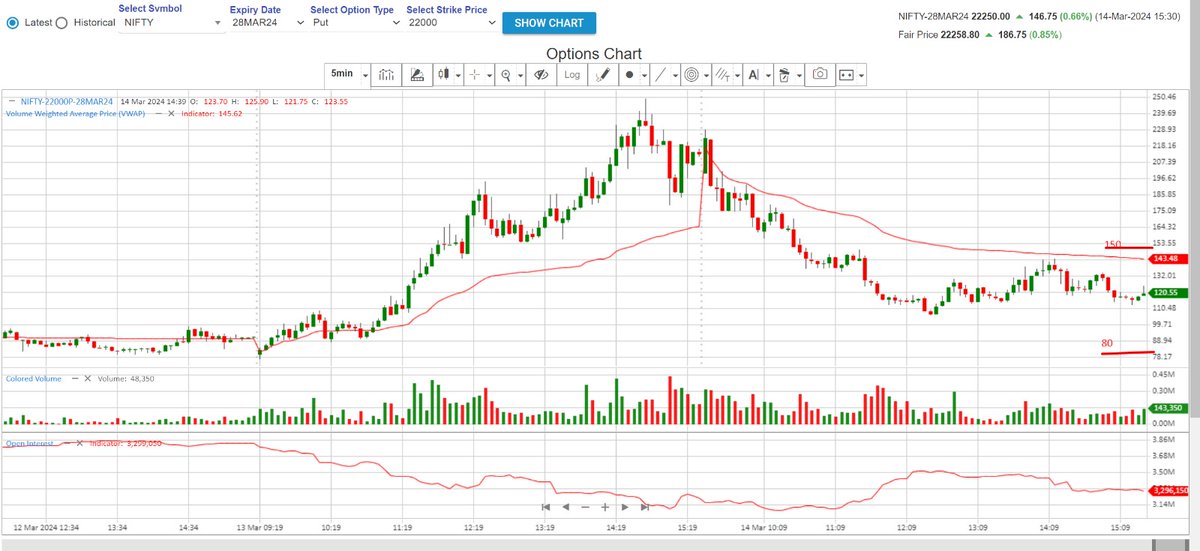
Nifty puts added OI from 22000-22000 which is normal as Nifty went up, so is the cut in the 22k ce OI.
What is abnormal is the cut in 22500pe, that should have added OI by the same logic.
So we now watch two strikes :
Nifty bullish if 22500pe trades below 310 and 22000pe trades below 80.

Nifty bearish if 22500pe trades above 392 and 22000pe trades above 150Image
Image
Image
Image
On BNF , two strikes stand out. The addition on the 47k ce ( thrice that of 47k pe) and addition in ITM 46500ce.

So we will watch these two strikes
BN bullish if the 46500ce trades above 1175 and 47000ce trades above 870
BN bearish if 46500ce trades below 850 and 47000ce trades below 580.

What's very interesting is the OI behavior on the 46500ce , the sellers kept on selling even when BN went up without any fear.

Makes me say they know something which makes BN much more bearish than NIFTYImage
Image
Image
Image
Last but not the least, my standard template on eod charts.
Make your own inferences, important to keep the broader picture in mind.
Image
Image
Read 4 tweets
Oct 4, 2023
BankNifty had an almost 28% increase in COI today. This COI increase in a large range day ( up or down) would have been justifiable, not in a range day like today. The only logic can be the coming RBI MPC meet from which someone is expecting something very very big Image
So I went back for the last couple of years and tried to check how BN behaves after such and increase in COI
Image
Image
Then went through the bhavcopy to check which month has seen the increase ( will give an idea / confirmation about these players when they are expecting the event). It's Oct expiry, so this is a near term game Image
Read 6 tweets
Jan 23, 2023
Thanks to everyone who enquired about my well being. For the last almost 2 months, suffering from probable long covid symptoms.

1. I am a type 2 diabetic. Sugar etc was always under control. Now sugars, cholesterol etc have all shot thru the roof. HBA1C at 9 , ACR is 130
2. Joint pains at shoulder , xray-usg-mri does not find any physical reasons

3. Huge fatigue. Getting out of bed or going out is a chore.
4. Problems with short term memory. I am forgetting certain things , have been pointed this out by my near family members, I did not realise this myself. This is actually pretty scary.

5. Abcesses/styes out of nowhere ( one was solved by a twitter doc friend)
Read 5 tweets

Did Thread Reader help you today?

Support us! We are indie developers!


This site is made by just two indie developers on a laptop doing marketing, support and development! Read more about the story.

Become a Premium Member ($3/month or $30/year) and get exclusive features!

Become Premium

Don't want to be a Premium member but still want to support us?

Make a small donation by buying us coffee ($5) or help with server cost ($10)

Donate via Paypal

Or Donate anonymously using crypto!

Ethereum

0xfe58350B80634f60Fa6Dc149a72b4DFbc17D341E copy

Bitcoin

3ATGMxNzCUFzxpMCHL5sWSt4DVtS8UqXpi copy

Thank you for your support!

Follow Us!

:(