Image
Showing a simple data analysis, mainly OI/COI analysis to show how I pick up direction from OI. This pic is of COI ( cumulative OI of 3 months added) of BNF. See that huge COI buildup yesterday. OI = net longs = net shorts at end of day. Question is, who is winning ? Image
At close today, prices are
1. below today"s vwap
2. below yesterday's vwap
3. below 1SD of vwap of yesterday
4. below 1SD of vwap of today Image
Now I have two anchored VWAPs plotted , an anchored vwap is a vwap which continues from a particular price point. Here we have the RED avwap from start of this weekly expiry, the blue one from yesterday opening ( remember the huge COI addition yesterday) Image
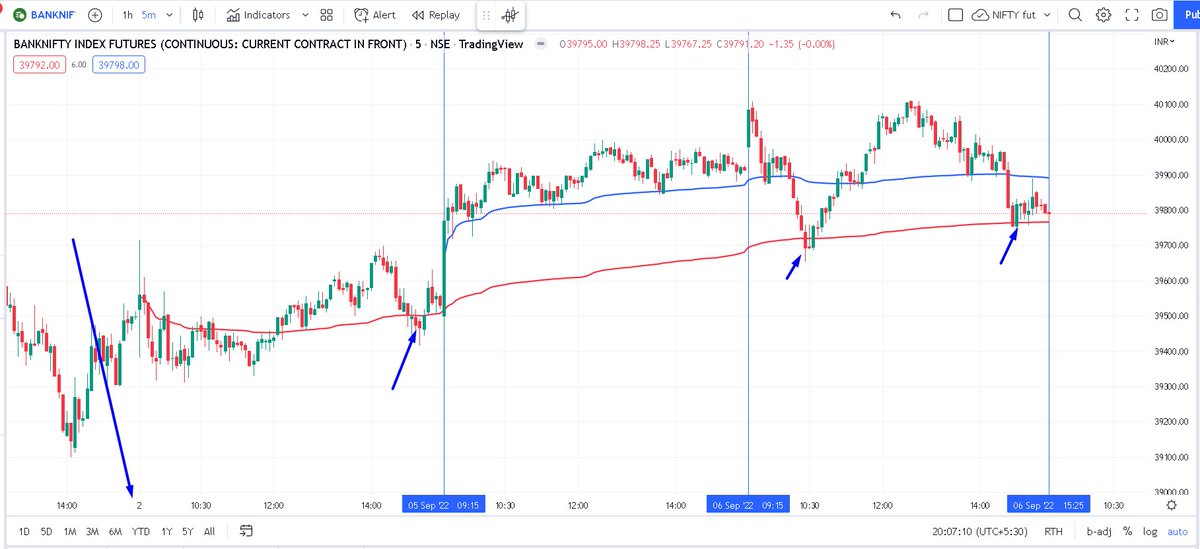
If you see the AVWAP from yesterday morning, the COI which was there now means longs are trapped ( since below avwap, shorters are getting money). If you see the AVWAP of this expiry, we already had 3 tests, generally the next breaks thru this avwap.
Targeting has a logic. Whatever price the instrument went above the avwap, same distance can be achieved on the downside. Which brings the target to 39400.

So, our trade on Sentient was a bear spread :
Buy 39800PE and sell 39400PE, debit=maxloss=160, max profit 240. Image
This was the chart shared with #sentient members at closing after we took the short Image
I also take a view on volatility if I take an overnight position, this is a proprietary logic. The BLUE + signs means VIX expected to go up and RED+ signs means VIX expected to go down Image

• • •

Missing some Tweet in this thread? You can try to force a refresh
 

Keep Current with Subhadip Nandy

Subhadip Nandy Profile picture

Stay in touch and get notified when new unrolls are available from this author!

Read all threads

This Thread may be Removed Anytime!

PDF

Twitter may remove this content at anytime! Save it as PDF for later use!

Try unrolling a thread yourself!

how to unroll video
  1. Follow @ThreadReaderApp to mention us!

  2. From a Twitter thread mention us with a keyword "unroll"
@threadreaderapp unroll

Practice here first or read more on our help page!

More from @SubhadipNandy16

Sep 5
What's up ITC ?
Disclaimer : running positions from lower levels. Whenever I post about ITC, please assume that I have positions
The COI buildup started from 26th August. I have drawn an anchored VWAP from that date, Once this AVWAP was crossed, this AVWAP providing support. As of now support at 319-20 range, stops to be below this and watch how far this goes
Read 4 tweets
Jun 17
Good question. Let me explain this with the data I was watching. Will explain the current scenario too.

First read this :
investopedia.com/terms/a/a-d-ra….
This is the NSE total AD line. See the move from march 2020 and the exhaustion from dec 21
This is the Nifty 50 AD line, self explanatory
Read 6 tweets
Jun 17
The sharp dip/selloff in March 2020 was followed by an equally sharp bounce-back and a bull market. Traders who have not seen a true bear market think that that's how markets operate.
Problem is that bounce-back was financed by money printing by all the central banks of the world
This bias I am seeing in a lot of tweets where people are jumping over each other in providing lists on what to buy. Everyone thinks that by being the first to suggest buys, they would be lauded as heroes when the market finally goes up ( it always ultimately goes up, right?)
One of the earliest things we learned as traders was
" DO NOT TRY TO CATCH A FALLING KNIFE".

This list sharing and enthusiasm shows retail is still not panicked or has given in by capitulation.

My view ? More pain ahead
Read 4 tweets
May 27
BITCOIN
Interestingly, someone is providing support at the marked zone. But each bounce is making a lower high than the previous one
Read 4 tweets
May 21
Jokes apart, let's see what the charts say. I normally do not open systems on a Saturday, but this friday move, SGX dance and finally the fuel excise cut made me curious. Do read with a pinch of salt as my decision might be clouded by the fact that I am carrying longs 😎
Positive divergences on RSI and MFI
Trendline breakouts on RSI and MFI without breakout of trendline on price. This is what I call "advance breakouts:, where indicators signal ahead of price. Also note MACD, a notoriously lagging trend indicator has already turned
Read 8 tweets
May 20
In early 2000s, we traded a stock called Ramco Systems. The stock was purely operator driven with regular buying and selling freezes. Such volatility attracted us daytraders like moths to a fire.
The bullish ones amongst us as well as the bearish ones, all lost money whatever we did. It was that kind of absurd moves, this was one operator whom we absolutely failed to decipher. So someone amongst us came up with a theory .
The operator must have got hold of a madman and made him sit on his terminal and allowed him to do whatever he liked.

Obviously, thus our logical / technical / screen reading skills were totally a failure 🤣🤣
Read 6 tweets

Did Thread Reader help you today?

Support us! We are indie developers!


This site is made by just two indie developers on a laptop doing marketing, support and development! Read more about the story.

Become a Premium Member ($3/month or $30/year) and get exclusive features!

Become Premium

Don't want to be a Premium member but still want to support us?

Make a small donation by buying us coffee ($5) or help with server cost ($10)

Donate via Paypal

Or Donate anonymously using crypto!

Ethereum

0xfe58350B80634f60Fa6Dc149a72b4DFbc17D341E copy

Bitcoin

3ATGMxNzCUFzxpMCHL5sWSt4DVtS8UqXpi copy

Thank you for your support!

Follow Us on Twitter!

:(