Tonight I brainstormed how to organize the Alberta COVID-19 data in a way that we could see seasonal commonalities, and compare the month that we are in now to prior years to get an accurate idea of where we are at in the grand scheme of things and I think I did it. #covid19ab
This is daily hospitalizations for 3 years overlapped. You can see how each year is increasingly worse, & trends like a wave in May in all 3 years. You can also see an uncharacteristic increase this summer, and that the highest numbers were in the winter and spring of 2022. 

Daily ICU numbers for 3 years overlapped. Here we can see that the Spring and Fall of 2021 were when most people were landing in the ICU. Interesting to see that we are currently below 2021 levels, but above 2020 levels, and that every year in July we have our lowest ICU numbers. 

Positivity rate. Here we can see that 2022's positivity rate has stayed higher than both 2020 & 2021 for the entire year so far. This also reflects that Spring wave, and a premature wave mid summer this year instead of late summer early fall. (That end of 2021 spike... wow!) 

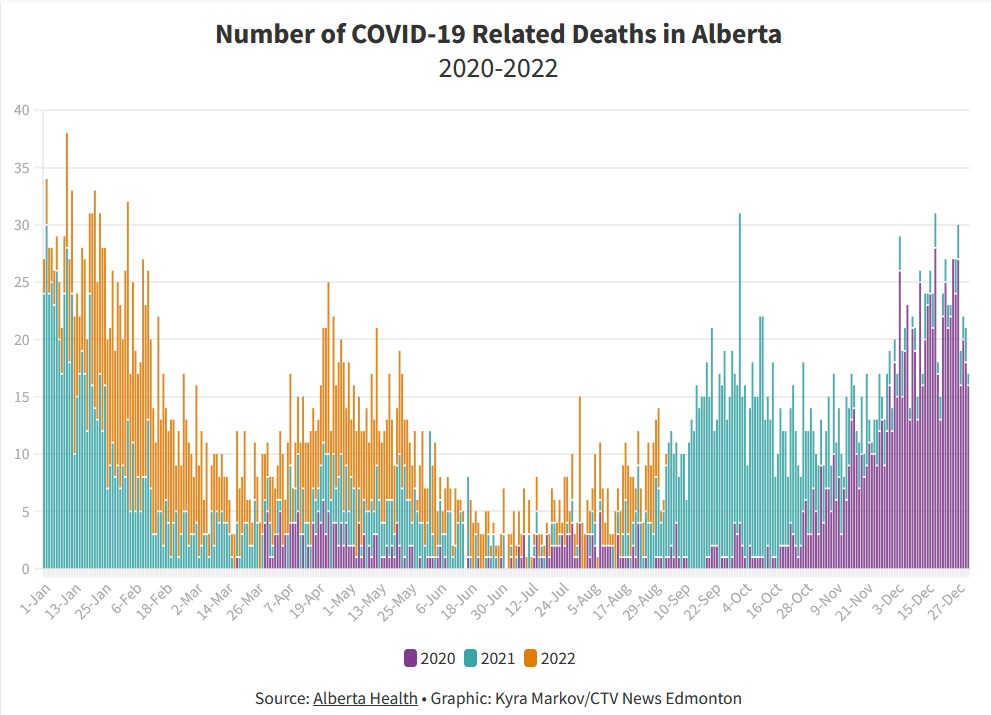
And then we have deaths. This was a challenging graph to make as it doesn't plot similarly to the others so this is the best I could do. However I do think this shows the low then increasing deaths in 2020, the higher deaths of 2021, and the even higher still deaths of 2022. 

I hope these make some sort of sense as it's very late and I should probably be sleeping... but I think that these graphs show some of the most accurate pictures yet of the pandemic in Alberta as a whole, and how where we are right now fits into that bigger picture. Stay safe.
• • •
Missing some Tweet in this thread? You can try to
force a refresh


