Brian Nosek Profile picture
Sep 9 7 tweets 2 min read
Massive status bias in peer review.

534 reviewers randomized to review the same paper revealing the low status, high status, or neither author. 65% reject low status, 23% reject high status.

Amazing work by Juergen Huber and colleagues. #prc9 Image
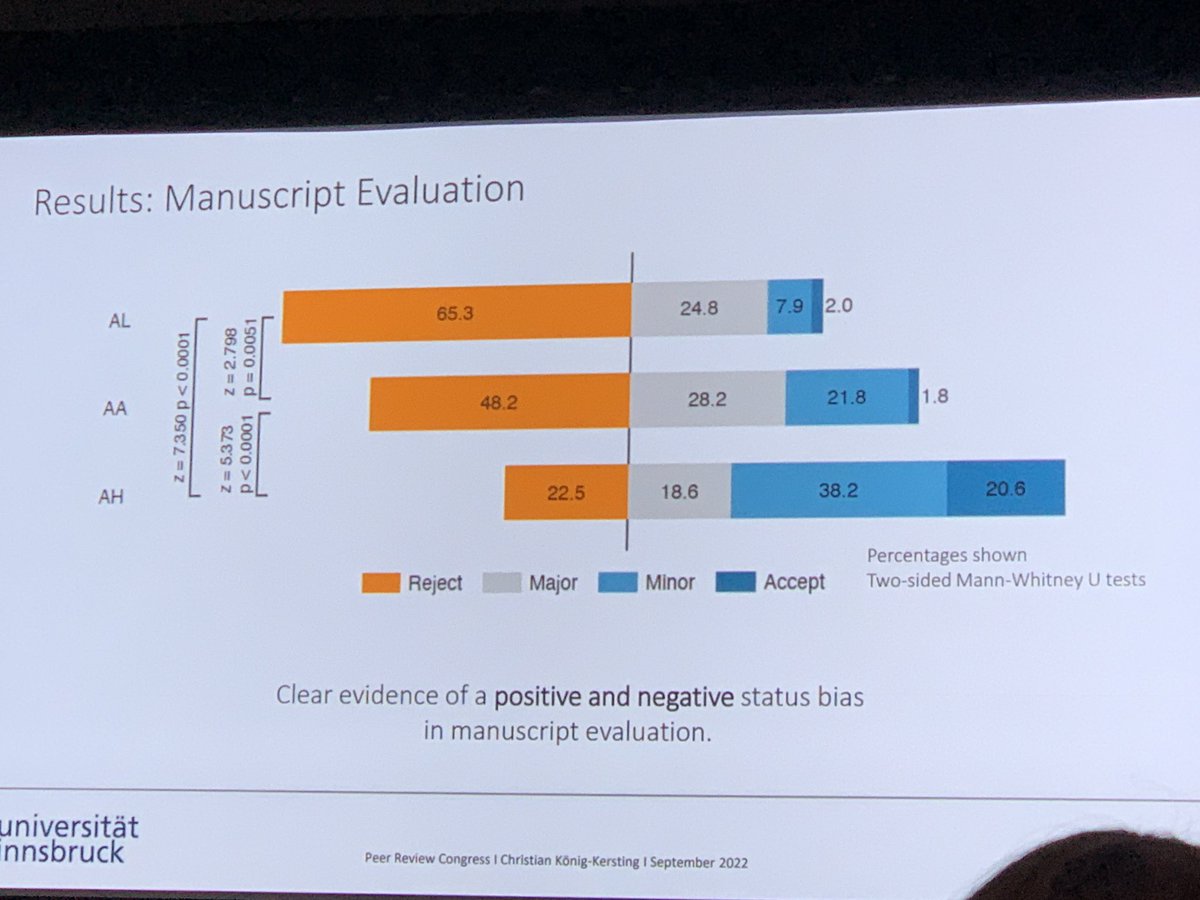
Or, look at it another way. If the reviewers knew only the low status author, just 2% said to accept without revisions. If the reviewers knew only the high status author, almost 21% said to accept without revisions. Image
I thought it was painful to have 25 reviewers for one of my papers. My condolences to these authors for having to read the comments from 534.
Gratitude to Sabiou Inoua and Vernon Smith for subjecting themselves and their scholarly work to conduct this project.
Secondary finding. >3000 potential reviewers were invited with the low, high, or neither status author revealed as the corresponding author in the review invitation. Reviewers substantially more likely to agree to review in the high status revealed condition. Image
Two important method notes: this journal offered to pay for review (explaining high agree rates maybe), and only those in the anonymous invite condition were then invited to the actual review with randomizing which author was revealed.
Here is a preprint to the paper: papers.ssrn.com/sol3/papers.cf…

• • •

Missing some Tweet in this thread? You can try to force a refresh
 

Keep Current with Brian Nosek

Brian Nosek Profile picture

Stay in touch and get notified when new unrolls are available from this author!

Read all threads

This Thread may be Removed Anytime!

PDF

Twitter may remove this content at anytime! Save it as PDF for later use!

Try unrolling a thread yourself!

how to unroll video
  1. Follow @ThreadReaderApp to mention us!

  2. From a Twitter thread mention us with a keyword "unroll"
@threadreaderapp unroll

Practice here first or read more on our help page!

More from @BrianNosek

May 7
Lovely replies on the upsides.

In case it is useful perspective for anyone else, here's part of how I managed the downsides as an ECR so that the upsides dominated my experience in academia.
Key downsides that needed managing for me: (a) dysfunctional culture that rewarded flashy findings over rigor and my core values, (b) extremely competitive job market, and (c) mysterious and seemingly life-defining "tenure"
In my 3rd year (~2000), I almost left grad school. Silicon valley was booming and calling. I was stressed, not sure that I could do the work. And I saw the dysfunctional reward system up close and wanted no part of that.

I didn't leave. I changed my perspective.
Read 15 tweets
Apr 18
Across my research on implicit bias, morality, ideology, reproducibility, and open science, I have been on the receiving end of a lot of scholarly criticism. It has been a gift to my career. But, not all criticism is equal.

My primary insight as a recipient...
Besides decency, there are strong self-interested reasons for critics to treat the subject of their criticism as well as possible.

Three points from what might be the most obvious to the somewhat less obvious:
1. Critics’ being mean and judgmental reduce their impact in both the short and long-run.

The receiver pays less attention to the critic's argument and draws unfavorable conclusions about their character.
Read 31 tweets
Jan 18
How does one stay motivated about academic work with the long delays and external influences of getting rewards? Here are some of my favorite strategies.

Short thread.

(Elaborating on a comment in a separate thread.)
It is great to celebrate wins (grants, publications), but they are partly outside of my control. I increase predictability and controllability of rewards by celebrating milestones that I control -- completion of data collection, posting a preprint, submitting the grant.
The long lag between starting a project and finishing it leads to very delayed reward and sometimes anticlimactic endings. I add celebrations and rewards for defined progress milestones along the way.
Read 8 tweets
Oct 3, 2021
Parents: Taste-testing is a great way to engage kids on science and how methodology can address potential biases.

Here's an example w/@LastCrumbCookie we did recently. This is after a few years of lots of simpler taste tests.
Most of our prior taste tests were amenable to some blinding such as comparing fast food chicken and fries and testing generic vs. brand-name.

Haven wanted to do @LastCrumbCookie and compare their 12 varieties. Blinding not possible & 12 is a lot to test! Challenging for design.
Haven and Joni also wanted to do a pre/post comparison to see if our expectations were good predictors of what we would actually like.

Finally, they wanted to evaluate the cookies holistically and needed a measurement strategy that captured important variation between cookies.
Read 14 tweets
Oct 3, 2021
For the last 2.5 years, my daughters and I have been rating breakfast places in #charlottesville #cville area. We rated 51 restaurants from 1 (worst) to 10 (best) on taste, presentation, menu, ambiance, & service. We also recorded cost-per-person.

Here's what we learned. 1/
Across 51 restaurants we spent $1,625.36 pre-tip, average cost of $9.91/person (sometimes other family members joined).

Cheapest per person: Duck Donuts $3.10, Sugar Shack $3.41, Bojangles $4.30.

Most expensive per person: The Ridley $27.08, Farm Bell Kitchen $17.81, Fig $17.44
Averaging all 5 ratings across all raters is one way to determine an overall rating. The grand average is 7.1 out of 10 w/ a range of 4.8 to 9.1. How strongly related are cost per person and overall rating?

r=0.36

Just 13% of the variation in quality is associated with cost.
Read 18 tweets
Jul 17, 2021
Sharpen your intuitions about plausibility of observed effect sizes.

r > .60?

Is that effect plausibly as large as the relationship between gender and height (.67) or nearness to the equator and temperature (.60)?
r > .50?

Is that effect plausibly as large as the relationship between gender and arm strength (.55) or increasing age and declining speed of information processing in adults (.52)?
r > .40?

Is that effect plausibly as large as the relationship between weight and height (.44), gender and self-reported nuturance (.42), or loss in habitat size and population decline (.40)?
Read 8 tweets

Did Thread Reader help you today?

Support us! We are indie developers!


This site is made by just two indie developers on a laptop doing marketing, support and development! Read more about the story.

Become a Premium Member ($3/month or $30/year) and get exclusive features!

Become Premium

Don't want to be a Premium member but still want to support us?

Make a small donation by buying us coffee ($5) or help with server cost ($10)

Donate via Paypal

Or Donate anonymously using crypto!

Ethereum

0xfe58350B80634f60Fa6Dc149a72b4DFbc17D341E copy

Bitcoin

3ATGMxNzCUFzxpMCHL5sWSt4DVtS8UqXpi copy

Thank you for your support!

Follow Us on Twitter!

:(