Karen Cutter Profile picture
Sep 15, 2022 13 tweets 5 min read Read on X
The NSW epi report for the week ending 10 Sept is now out. Note that this is the week ending just before they switched from daily to weekly reporting, so nothing new on that front.
#Covid19Aus #Covid19NSW
You can find the full report here...
health.nsw.gov.au/Infectious/cov…
Cases are down another 29% this week. Excellent.
While PCR testing is down again (-15%), so is positivity (at 7% this week). Good.
Cases are down in all age groups, ranging from -24% to -34%. And the biggest fall was in the 60+ age group. Excellent.
This is a new graph, showing cumulative infection rates by age band since 1 Jan 2022.
The over 50s clearly much lower than other age bands. The 0-9s also lower, which may be partly real but I also suspect (no proof) that this age group may be tested less than older ages.
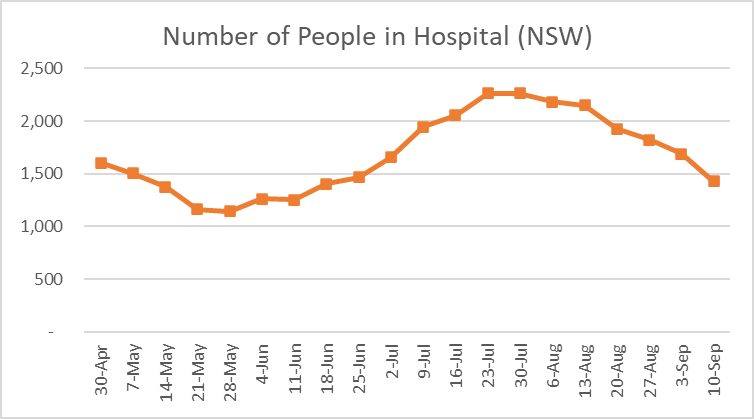
The number of people in hospital fell by 15% this week. Awesome. I've been waiting for a double digit reduction.
People admitted to hospital this week fell by a whopping 30%. Fantastic.
By age band, reductions in hospitalisations were mainly in the 60-79 and 80-89 age bands. Brilliant.
122 deaths this week. Similar numbers to the previous 2 weeks. Never good.
The proportion of deaths in aged care residents up a little after a low week last week.
Variants of concern are interesting. NSW shows two things. This first graph shows a breakdown by variant of people in hospital or those arriving from overseas (so a biased sample).
It shows an increase in BA.2.75 which some people are saying may cause the next wave.
This second graph shows a broader picture, being the results of all tests from one of the large pathology providers. It shows the proportion with s-gene target failure (i.e. NOT any of the BA.2. strains). It shows no worrying trend. So hopefully the previous graph ....
.... is just an anomaly due to the biased sample and is not a more widespread issue.

The end. Any questions?

• • •

Missing some Tweet in this thread? You can try to force a refresh
 

Keep Current with Karen Cutter

Karen Cutter Profile picture

Stay in touch and get notified when new unrolls are available from this author!

Read all threads

This Thread may be Removed Anytime!

PDF

Twitter may remove this content at anytime! Save it as PDF for later use!

Try unrolling a thread yourself!

how to unroll video
  1. Follow @ThreadReaderApp to mention us!

  2. From a Twitter thread mention us with a keyword "unroll"
@threadreaderapp unroll

Practice here first or read more on our help page!

More from @KarenCutter4

Jul 28
The Mortality Working Group has today published our Research Paper covering excess mortality in 2020-2023.
actuaries.asn.au/public-policy-…
It is a massive paper (100+ pages), so I'm not going to cover off all of it!
This thread gives a taster of what is included in the paper, and is aimed at those who may want to delve further into the nitty-gritty.
There are four main sections of our paper (plus an into in section 1).
Section 2 cover excess mortality for Australia. This formally documents the excess mortality blogs we published throughout 2023. For those who have been following me, the numbers will look familiar.
Read 14 tweets
Jul 11
The Mortality Working Group of the Actuaries Institute has released their latest estimate of excess mortality for Q1 2024.
TLDR: excess mortality is 1%, noting this is measured against the new baseline.
actuaries.digital/2024/07/10/exc…
Our new baseline measures 2024 mortality against 2023 (after allowing for some mortality improvement), and includes and allowance for COVID-19 deaths.
Deaths from all causes have been within the 95% confidence interval in each of the first thirteen weeks of 2024, although they have been towards the top of that range for three of the last four weeks of March. Image
Read 6 tweets
Apr 12
Some fact checking on this article.
TLDR: Australia has not reached a 'significant' COVID milestone
A short thread/
"Australia appears to have had at least a week where no COVID-associated deaths were recorded for the first time in more than two years."
This is simply not true. The statement is based on this Fed Health graph. Image
Yes, it does show a 7-day average of zero deaths for the most recent data points. But this ignores the fact that the graph is compiled using date of death, and it is almost impossible for someone to die, have their death registered, and included in the Fed data within a week! Image
Read 11 tweets
Apr 5
The Mortality Working Group of the Actuaries Institute has released our estimate of excess mortality for the full year 2023.
TLDR: Excess mortality for 2023 is 5% (95% CI: 3%-7%) or +8,400 deaths.
A thread/
actuaries.digital/2024/04/05/exc…
Note that our expected number of deaths (baseline) is our expectation had the pandemic not happened.
The baseline allows for changes in the age and size composition of the population over time, plus allows for pre-pandemic mortality trend to continue.
We finished the year with deaths being much higher than expected for each of the four weeks in December (as they were in November). Image
Read 15 tweets
Mar 27
Australian deaths counts: surveillance vs death certificates.
For some time now I have been quizzically looking at the death surveillance reporting, thinking the numbers looked too low.
A thread/
This is because of the relationship between hospitalisations and deaths.
Normally deaths track hospital admissions quite closely, but with a little bit of a lag. But for Dec23 and Jan24, this relationship changed - deaths are lower than expected based on hospitalisations. Image
A few theories were floating around about why (eg. JN.1 less severe), but it also didnt make sense to me from looking at the Vic death reporting, and knowing the Vic wave was a bit earlier than the rest of Aust. Things just werent stacking up nicely.
Read 8 tweets
Mar 1
The Mortality Working Group* of the Actuaries Institute has estimated Australian excess mortality to 30 November 2023.

A thread/

* re-branded as we plan to look at more than just Covid
Total excess mortality for the first 11 months of 2023 is estimated at 5% (95% confidence interval: 3% to 7%).
This is about 7,400 more deaths than expected if the pandemic had not happened.
This compares to excess mortality for 2022 of 11%.
With only one month of data still to be reported for 2023, we expect that excess mortality for the full year 2023 will be about half the level of 2022.
Read 11 tweets

Did Thread Reader help you today?

Support us! We are indie developers!


This site is made by just two indie developers on a laptop doing marketing, support and development! Read more about the story.

Become a Premium Member ($3/month or $30/year) and get exclusive features!

Become Premium

Don't want to be a Premium member but still want to support us?

Make a small donation by buying us coffee ($5) or help with server cost ($10)

Donate via Paypal

Or Donate anonymously using crypto!

Ethereum

0xfe58350B80634f60Fa6Dc149a72b4DFbc17D341E copy

Bitcoin

3ATGMxNzCUFzxpMCHL5sWSt4DVtS8UqXpi copy

Thank you for your support!

Follow Us!

:(