
How to find high probability intraday reversal trades?
(1/n)
(1/n)
One of the challenges a day trader faces is to identify whether the chances of trend continuation in direction of open is higher
or if
market will reverse and change trend on intraday basis.
(2/n)
or if
market will reverse and change trend on intraday basis.
(2/n)
I look at two things to understand if there is a higher chance of trend continuation or if trend reverses.
Orderflow helps a trader understand whether big players are buying or selling at a particular level.
(3/n)
Orderflow helps a trader understand whether big players are buying or selling at a particular level.
(3/n)
Volume profile will help a trader understand if the location is important from a higher timeframe POV and if we saw huge buying/selling happen earlier at a zone.
(4/n)
(4/n)
Additionally, a trader can also look at crucial zones from a price action point of view like previous day/week high, low.
Combining these two aspects, a trader can look for high probability reversal moves and capitalize on it.
(5/n)
Combining these two aspects, a trader can look for high probability reversal moves and capitalize on it.
(5/n)
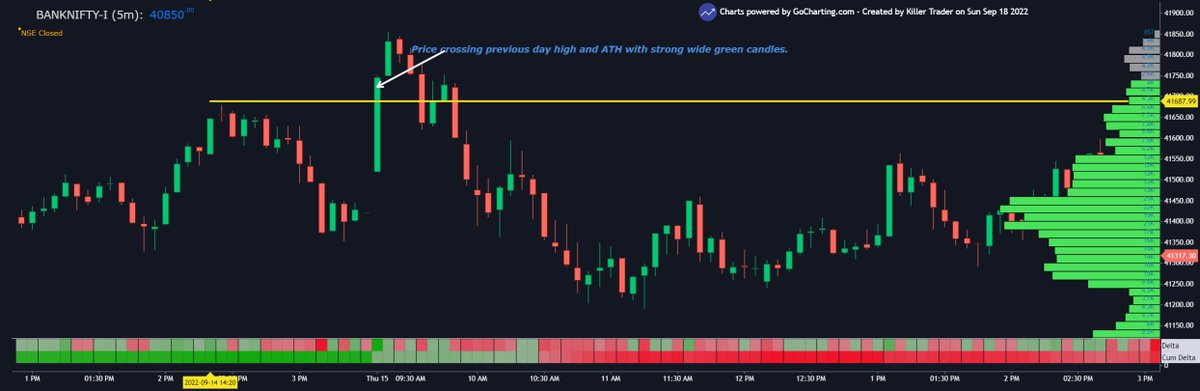
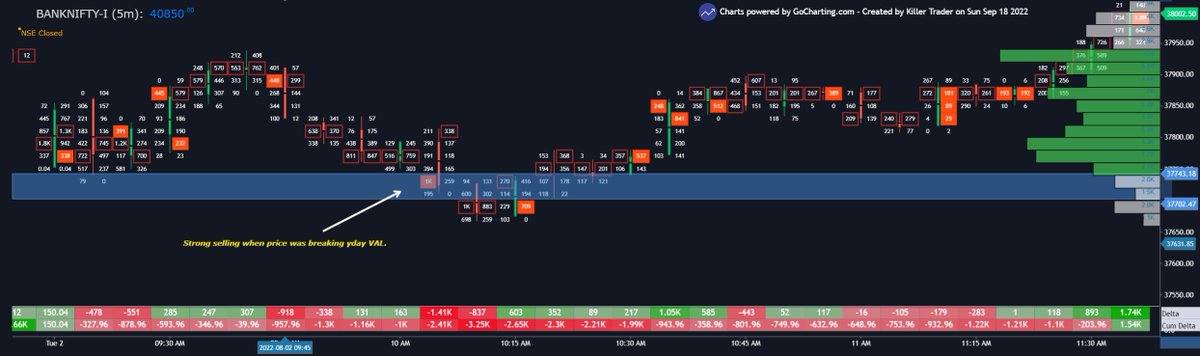
In below chart, BN futures crossed prev day high, all time high at open. Price action was strong and bullish. But what was orderflow indicating behind price?
Read on to find out.
(6/n)
Read on to find out.
(6/n)
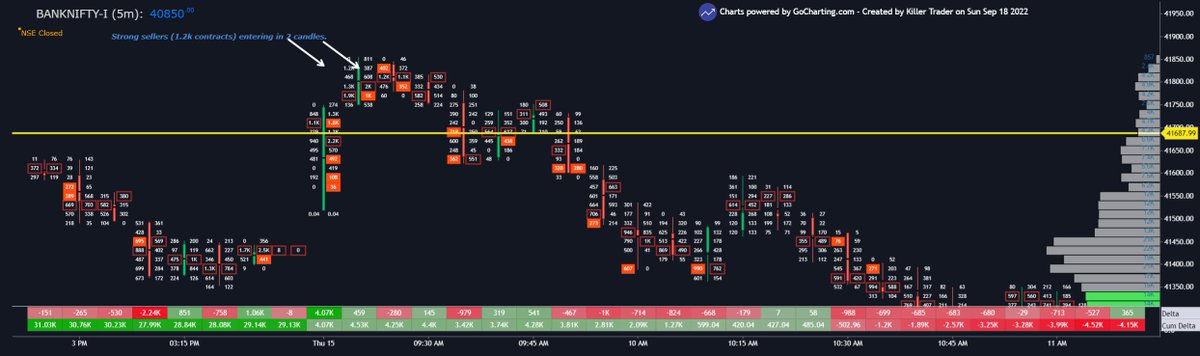
At 9:20 candle, strong sellers entered at highs and price stopped moving up. In 9:25 candle, we again saw strong sellers coming in.
This indicated high chance of breakout failure at important zone of prev day and all time high.
(7/n)
This indicated high chance of breakout failure at important zone of prev day and all time high.
(7/n)
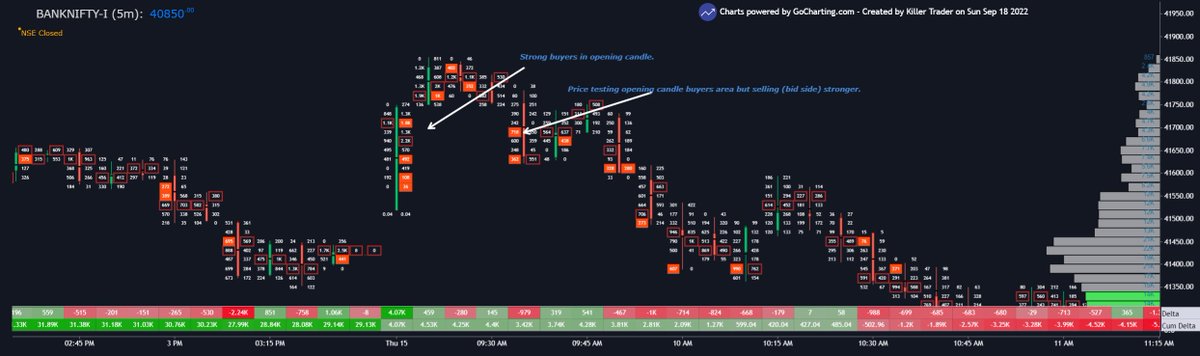
After that, when price was testing opening buyers areas, we saw more selling coming in compared to buying. See the lesser buying on ask side.
This indicates the increasing strength of sellers and lack of buyers initiative to defend the downmove.
(8/n)
This indicates the increasing strength of sellers and lack of buyers initiative to defend the downmove.
(8/n)
This confirmed change of direction from uptrend and sellers taking control of the market.
Notice that in any of the next candles, we did not see strong buying happening and it was sellers who were aggressive.
(9/n)
Notice that in any of the next candles, we did not see strong buying happening and it was sellers who were aggressive.
(9/n)
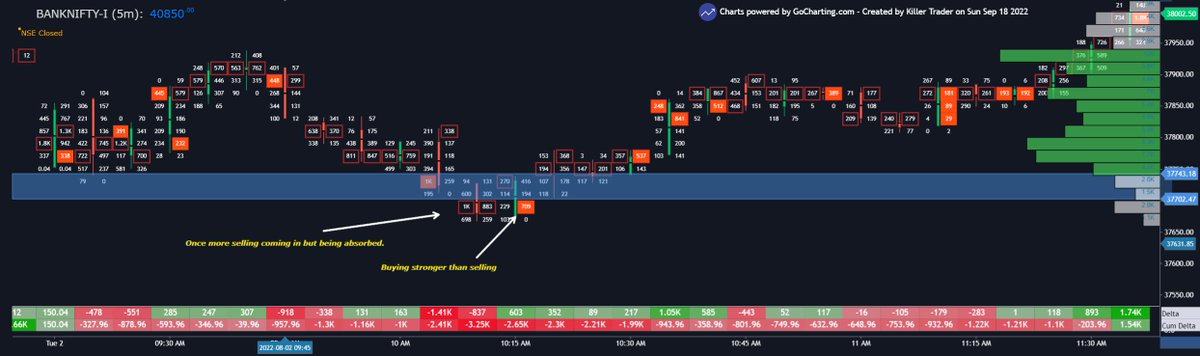
In the below chart, we saw a break of prev day value area low and eventually a breakdown failure.
(10/n)
(10/n)
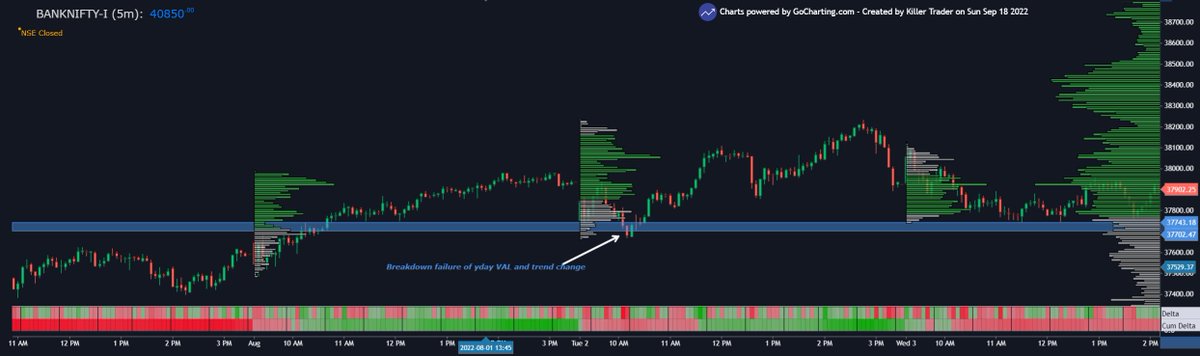
When breakdown was happening, we saw the presence of strong sellers. This would have indicated us to short the breakdown.
(11/n)
(11/n)
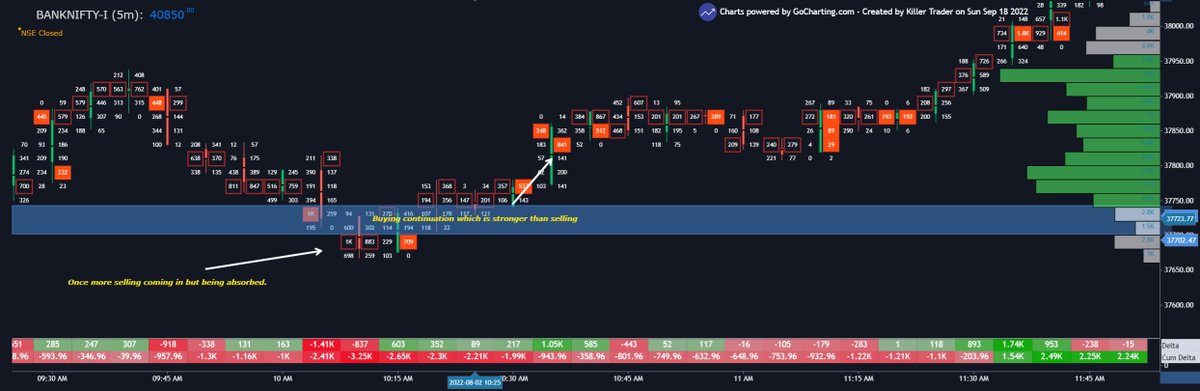
After we put on the short trade, immediately in the next two candles we saw the selling absorbed and buying stronger than selling. Price also went inside yday VAL indicating breakdown failure.
(12/n)
(12/n)
This was the indication for us to exit our shorts at a minor loss and wait for fresh signal.
A couple of 5 mins candles later, we could see large buying coming in which was stronger than selling.
This was the indication that trend was once again changing and go long
(13/n)
A couple of 5 mins candles later, we could see large buying coming in which was stronger than selling.
This was the indication that trend was once again changing and go long
(13/n)
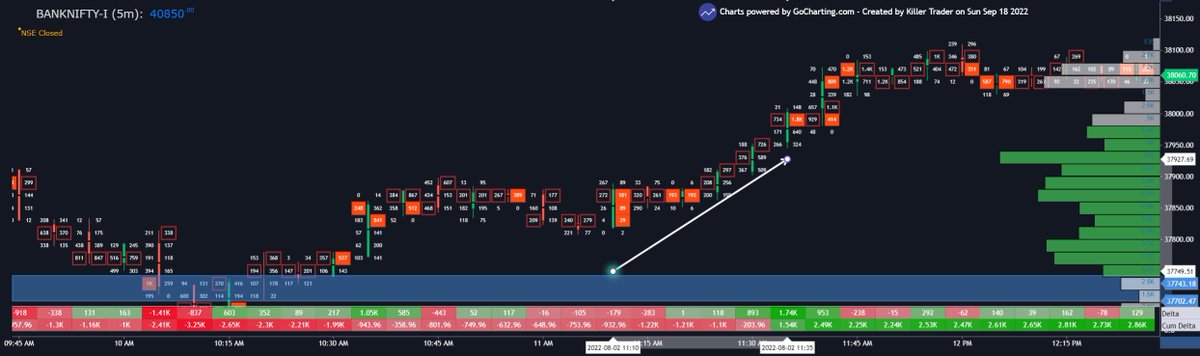
This strong buying triggered a upmove. Sellers who sold and were trapped at lower levels would also be running for exit.
300 points move from the zone
(14/n)
300 points move from the zone
(14/n)
How does this info help us? Is it a 100% no loss technique? NO.
Using orderflow helps us understanding the big buying and selling activity that is happening behind candlestick charts.
(15/n)
Using orderflow helps us understanding the big buying and selling activity that is happening behind candlestick charts.
(15/n)
It helps us to be on the stronger side of the trend majority of the times.
When we are wrong (all traders go wrong now and then), orderflow helps us exit quickly.
(16/n)
When we are wrong (all traders go wrong now and then), orderflow helps us exit quickly.
(16/n)
Learning to spot such patterns in orderflow for trend reversals also helps a trader to change direction with conviction and confidence.
(17/n)
(17/n)
If you found the knowledge shared useful, please re-tweet and like this tweet.
Follow me @KillerTrader_ for more such information.
Telegram for daily OF analysis: t.me/thekillertrader
(18/n)
Follow me @KillerTrader_ for more such information.
Telegram for daily OF analysis: t.me/thekillertrader
(18/n)
• • •
Missing some Tweet in this thread? You can try to
force a refresh


