Ujaval Gandhi Profile picture
Sep 23, 2022 7 tweets 8 min read Read on X
Happy to announce my new course Mapping and Data Visualization with #Python. This has been in the making for over a year and excited to be able to share it with the world! The full course is free for self-study and shared under an open license. An overview thread below 👇 1/n
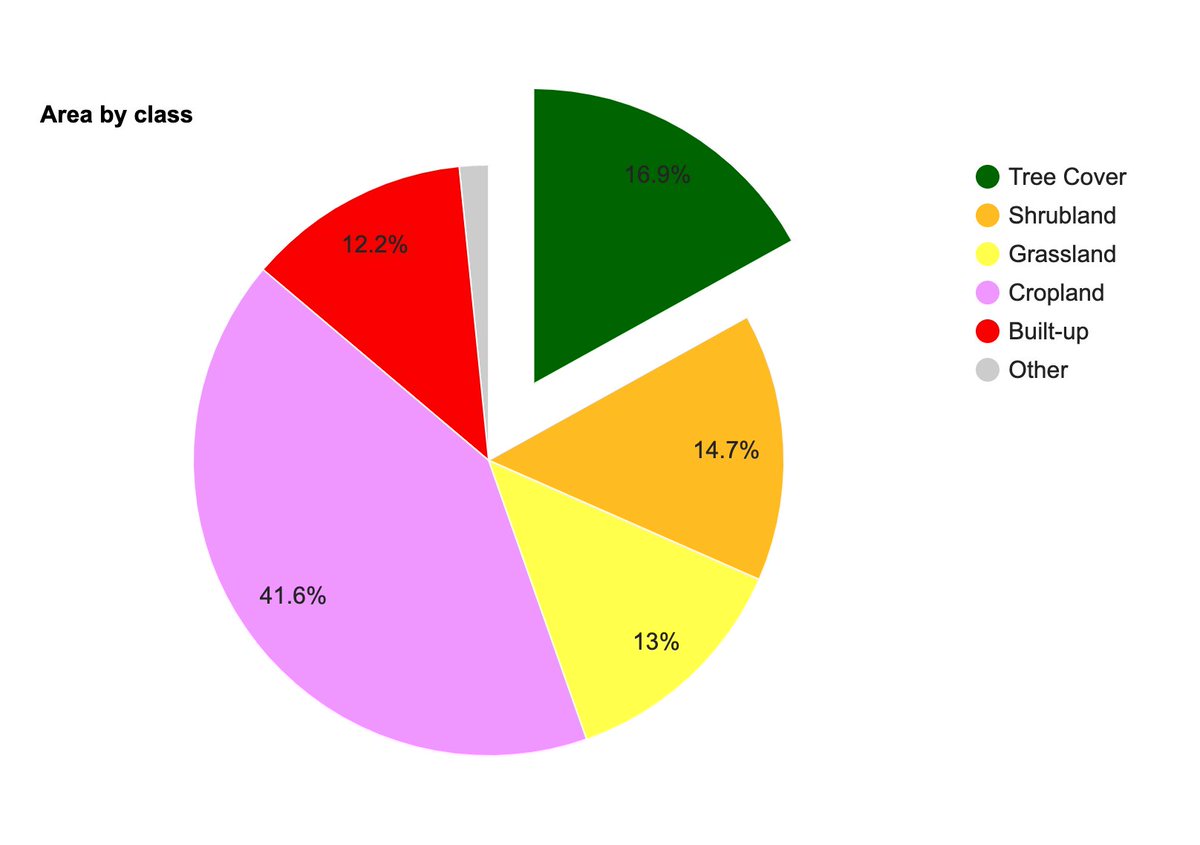
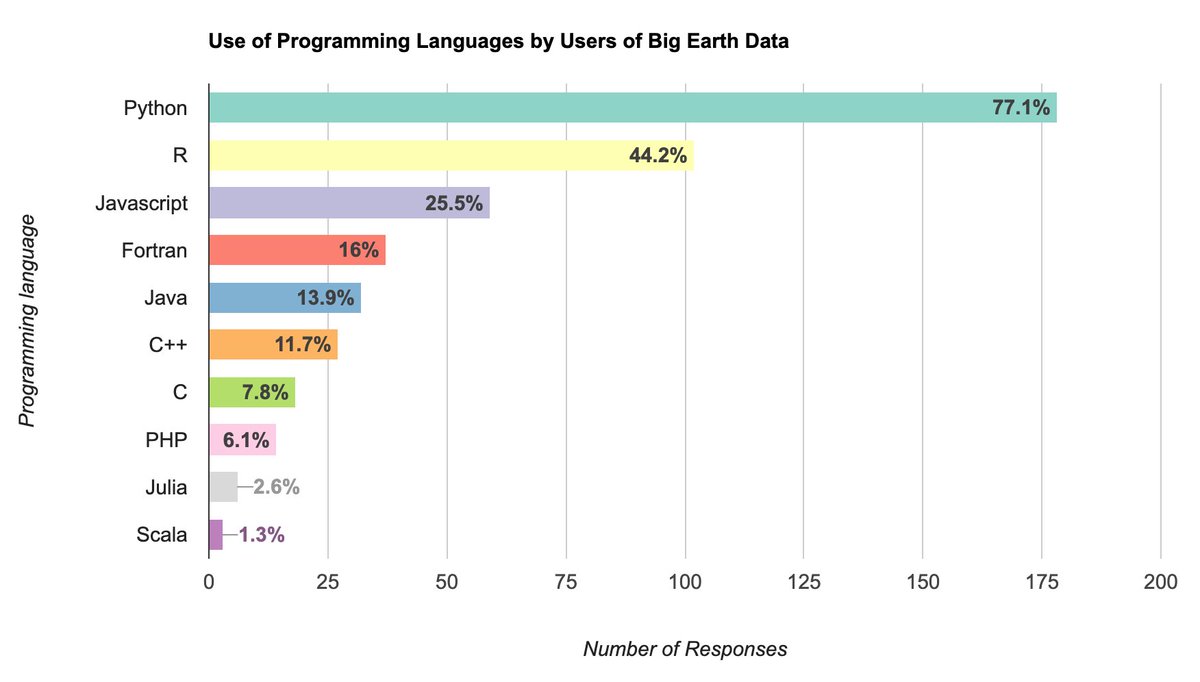
We start with the overview of the Python data visualization landscape and zero in on the core libraries for mapping. Day 1 covers vector data visualization with #Maptplotlib, #Pandas, #GeoPandas, and #Contextily (2/n)
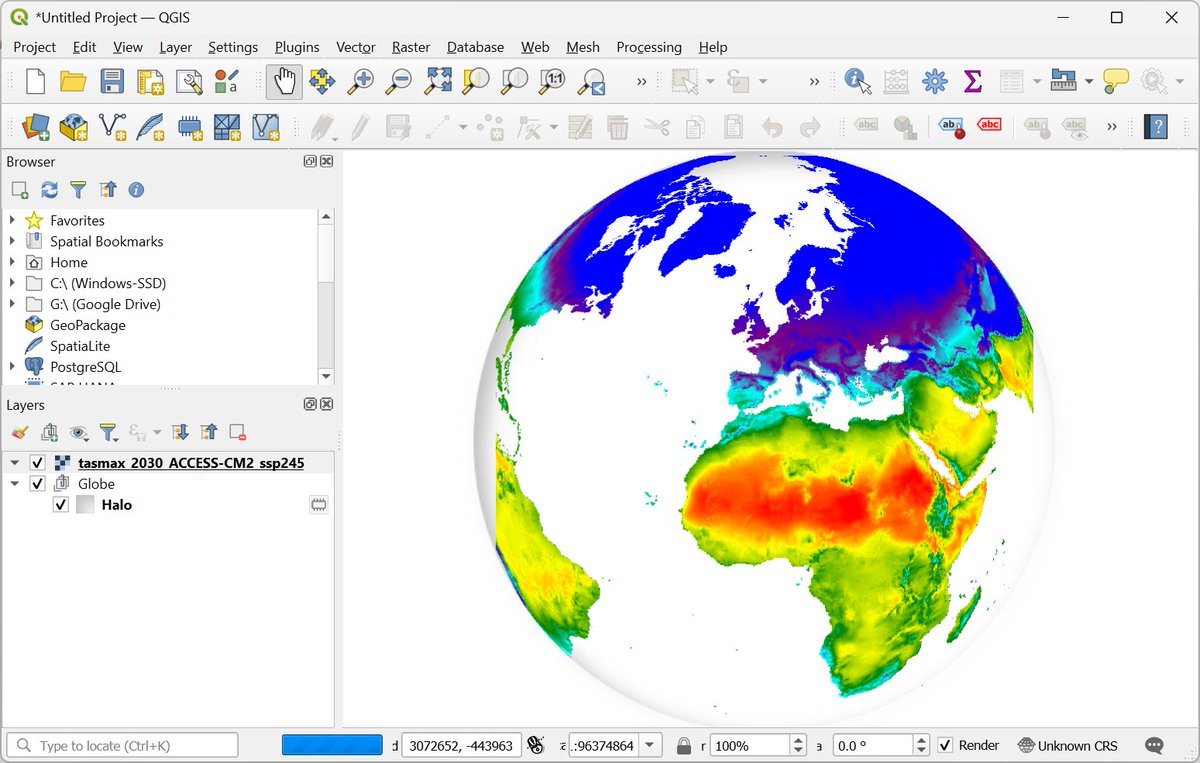
Day 2 starts with a deep dive into XArray and raster data visualization. We use #Xarray, #rioxarray and #CartoPy to visualize elevation and gridded climate datasets and learn some advanced #Matplotlib tricks. (3/n)
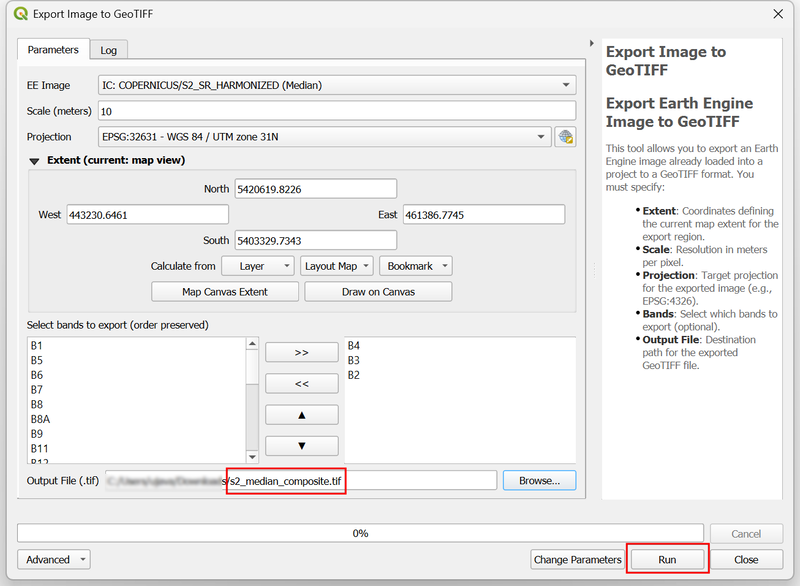
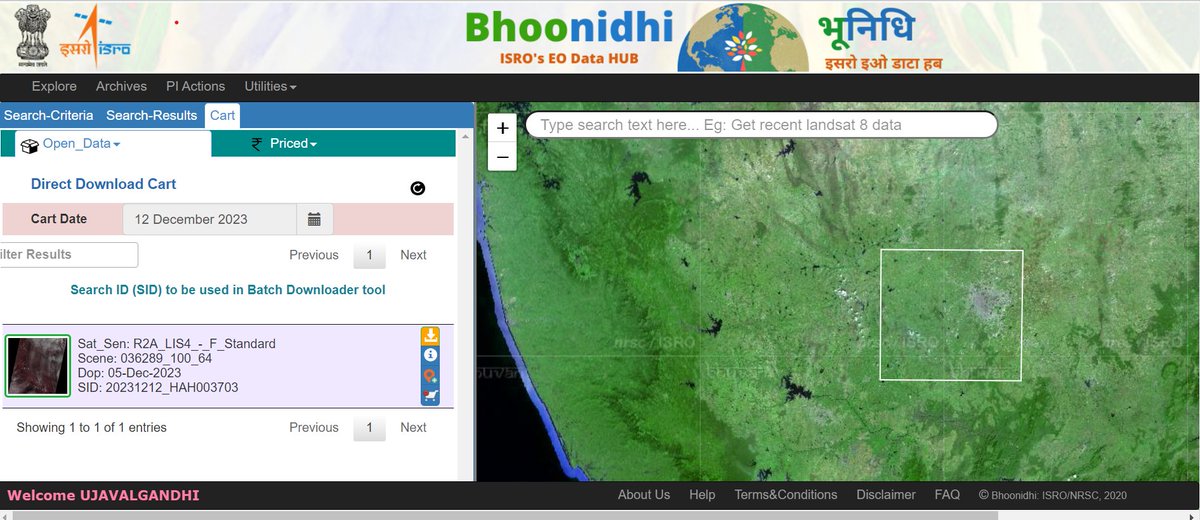
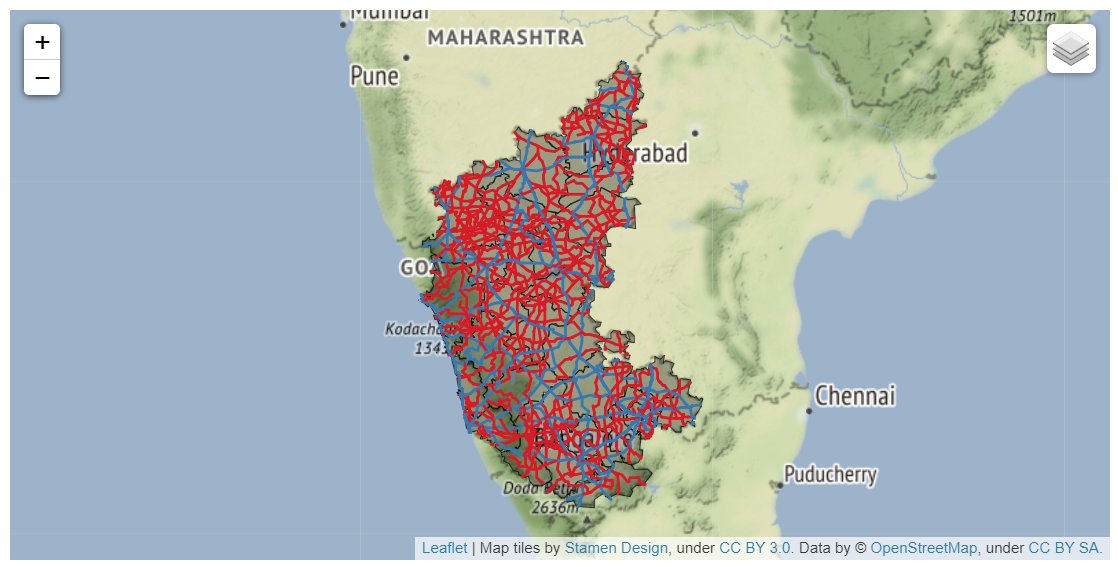
On Day 3, we switch gears and start covering libraries for interactive mapping. We use #Folium, #GeoPandas, and #Leafmap to create interactive maps with a range of geospatial datasets, including how to use Cloud-Optimized GeoTIFFs (#COG) for visualizing large rasters. (4/n)
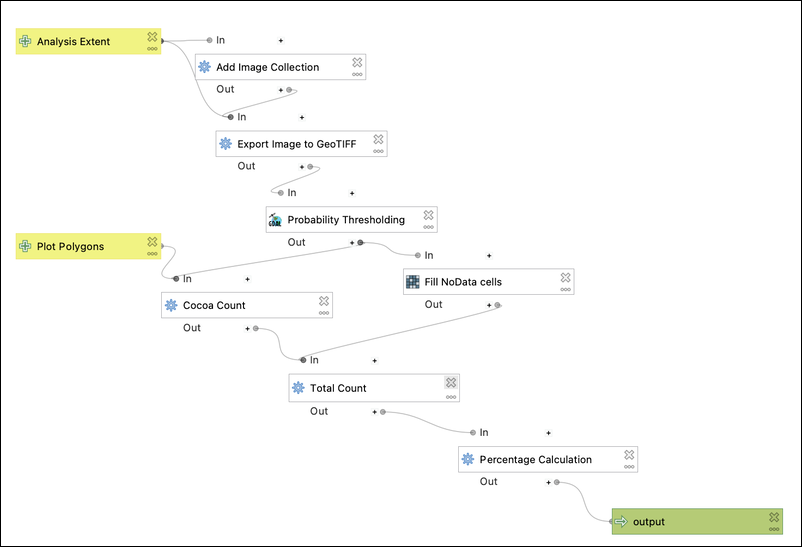
The last day is dedicated to learning how to build apps and dashboards with #Streamlit. We put together everything we learned in the class so far - and build a dashboard, a geocoding app, and a multi-layer mapping app using #Leafmap and publish it on #Streamlit cloud (5/n)
The whole course is organized as a series of #Jupyter notebooks that can be run on #Colab with zero configuration. I hope this makes the exercises approachable to beginners. Check out the full course on our OpenCourseWare site and start learning! courses.spatialthoughts.com/python-dataviz…
This course is also offered as a live online cohort-based class that attracts professionals from across the world. The live classes come with free lifetime support and certification! Check out our instructor-led offerings at spatialthoughts.com/events/

• • •

Missing some Tweet in this thread? You can try to force a refresh
 

Keep Current with Ujaval Gandhi

Ujaval Gandhi Profile picture

Stay in touch and get notified when new unrolls are available from this author!

Read all threads

This Thread may be Removed Anytime!

PDF

Twitter may remove this content at anytime! Save it as PDF for later use!

Try unrolling a thread yourself!

how to unroll video
  1. Follow @ThreadReaderApp to mention us!

  2. From a Twitter thread mention us with a keyword "unroll"
@threadreaderapp unroll

Practice here first or read more on our help page!

More from @spatialthoughts

Mar 14
Want to learn #Python for #Geospatial Analysis? We just launched our "Python Foundation for Spatial Analysis" course on YouTube - completely free and optimized for self-study. Check out the playlist at (1/n) youtube.com/playlist?list=…
Image
The course starts with Python fundamentals and covers fundamentals of Jupyter notebooks, variables, data structures, string operations, for-loops, conditionals, and functions - all while focusing on problems in the geospatial domain. (2/n)


Image
Image
Image
Image
We then learn how to compute the distance between 2 cities - first using the #Python Standard library, then #GeoPy, and eventually learning about Web APIs and calculating real-world driving distance using the #OpenRouteService API. (3/n)


Image
Image
Image
Read 10 tweets
Dec 12, 2023
Never thought I would see this day! NRSC has implemented ISRO's India Space Policy 2023 and started releasing 5m resolution ResourceSat2 LISS4 imagery as open data. You can sign up and download data from NRSC's Bhoonidhi Portal (1/n) bhoonidhi.nrsc.gov.in/bhoonidhi/inde…
Image
LISS4 sensor has 3 bands (NIR/Red/Green) at 5m GSD. The download comes with 3 GeoTIFFs and a metadata file. The pixels are DNs that need to be converted to reflectances. After conversion - there's a close match to Sentinel-2. You can see the improvement in resolution (2/n)
The data license is 'free-and-open' that allows non-commercial and commercial use. But unfortunately no commercial re-distribution. The language is unclear but I think it means other data portals and platforms like GEE cannot distribute this data. (3/n) bhoonidhi.nrsc.gov.in/bhoonidhi/html…
Image
Read 4 tweets
Dec 11, 2023
I conducted a workshop on Monitoring Land Use Land Cover Changes with Google #EarthEngine and #DynamicWorld at #InGARSS2023. Sharing the full workshop material that has some new monitoring examples with JS and #Python code. See the thread below for details and explanation 👇(1/n) Image
The workshop focused on understanding and using the #DynamicWorld dataset for monitoring applications. The key takeaway is that the probability bands provide a way to build monitoring applications with simple rule-based models at the global scale at high temporal frequency. (2/n) Image
The first case study covers continuous landcover monitoring and shows how one can delineate lake/reservoir boundaries at a monthly frequency anywhere in the world and export the results as shapefiles. You can adjust the threshold to include/exclude wetlands at the edges. (3/n)
Read 7 tweets
Jun 11, 2023
Releasing a new Google #EarthEngine workshop titled "Creating Publication Quality Charts with GEE" with completely open materials and code. A structured guide to help you create beautiful and informative visualizations from climate and earth observation datasets. A thread (1/n)👇


Image
Image
Image
Image
The workshop starts with an introduction to the GEE charting API. Module 1 covers Time-Series charts with a focus on learning the API and customization options. We work with Weather Forecast (GFS), Climate (TerraClimate), Precipitation (CHIRPS), and MODIS datasets. (2/n)


Image
Image
Image
Image
Module 2 explores the functions for creating charts from images. The exercises show how to create Histograms, Tables, and Scatter plots from Night Time Lights (NTL), ESA WorldCover, and Sentinel-2 Multispectral Images. (3/n)

Image
Image
Image
Read 10 tweets
Mar 25, 2023
Want to improve your #Python geospatial skills? Check out my new video tutorial series covering spatial data analysis and visualization with #Pandas, #GeoPandas, #XArray, #Dask, #STAC #OpenRouteService API and more. Many more in the pipeline. I'll post these in the thread below👇
Tutorial 1: Spatial Queries using #GeoPandas: This tutorial shows you how to use select points from a layer within a certain distance from features in another layer using GeoPandas.
Tutorial 2: Subset a Shapefile using a Spreadsheet with #Pandas and #GeoPandas: This tutorial shows you how to use extract a subset from a shapefile using data contained in an Excel spreadsheet.
Read 4 tweets
Jun 10, 2022
A thread about the newly launched #DynamicWorld landcover dataset by #Google. I had early access and explored this dataset in detail. You may be very excited about this dataset, but likely for the wrong reasons. Sharing some insights, potential use cases, and pitfalls. 1/n
First of all - what is it? It's a Landcover dataset based on Sentinel-2 data - but with a key difference. Rather than a static snapshot, it is a time series. *Every* Sentinel-2 scene is classified with class probabilities for 9 landcover classes. 2/n
It is an incredible technological feat. The dataset contains not just every Sentinel-2 scene from the archive, but every new scene is classified and made available in just a few minutes to all #EarthEngine users a through a dynamic collection 3/n developers.google.com/earth-engine/d…
Read 12 tweets

Did Thread Reader help you today?

Support us! We are indie developers!


This site is made by just two indie developers on a laptop doing marketing, support and development! Read more about the story.

Become a Premium Member ($3/month or $30/year) and get exclusive features!

Become Premium

Don't want to be a Premium member but still want to support us?

Make a small donation by buying us coffee ($5) or help with server cost ($10)

Donate via Paypal

Or Donate anonymously using crypto!

Ethereum

0xfe58350B80634f60Fa6Dc149a72b4DFbc17D341E copy

Bitcoin

3ATGMxNzCUFzxpMCHL5sWSt4DVtS8UqXpi copy

Thank you for your support!

Follow Us!

:(