You might have seen people using Open Interest, CVD, and Predicted Funding rates to help inform a trading position. 📈 💻📉
So what exactly is this stuff? and how can you set it up yourself for free?
So what exactly is this stuff? and how can you set it up yourself for free?

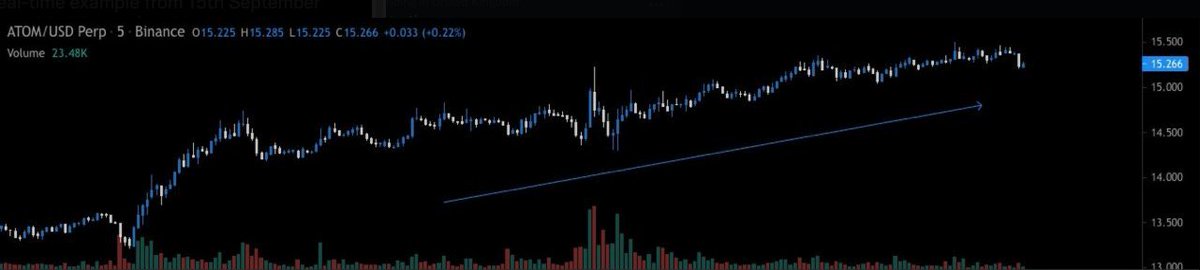
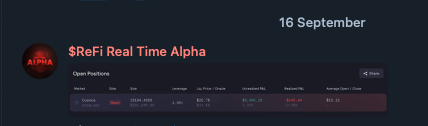
But first, a real-time example from 15th September when we shorted $ATOM at $15.22
Here's the thesis we wrote out to short $ATOM.
What were these "few other indicators"?
Here's the thesis we wrote out to short $ATOM.
What were these "few other indicators"?

Here's the rest of the conversation below. I'll try to break down each piece and then show you how to set these indicators up yourself.

1. "Price up but volume declining"
This is pretty self-explanatory. A rally on decreasing volume shows signs of buyer exhaustion.
This is pretty self-explanatory. A rally on decreasing volume shows signs of buyer exhaustion.
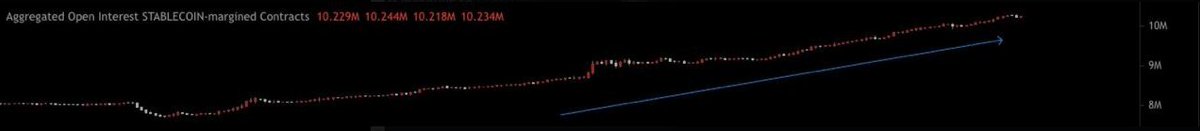
2. "open interest up (lots of people going leveraged long"
Open interest (OI) is simply the number of open derivatives contracts on a particular asset. For me, it shows that there has been a lot of activity in $ATOM, which is now vulnerable.
Open interest (OI) is simply the number of open derivatives contracts on a particular asset. For me, it shows that there has been a lot of activity in $ATOM, which is now vulnerable.
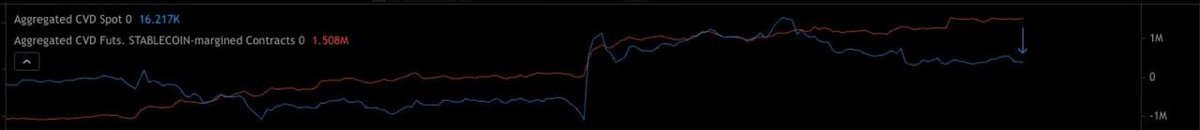
3. "spot is selling i.e. blue line, perps are buying i.e. red line"
CVD is a trend indicator. It shows the size in which spot has been bought/sold, and the same for perpetual buying/selling. The divergence between the two is often telling as perps tend to be more speculative.
CVD is a trend indicator. It shows the size in which spot has been bought/sold, and the same for perpetual buying/selling. The divergence between the two is often telling as perps tend to be more speculative.
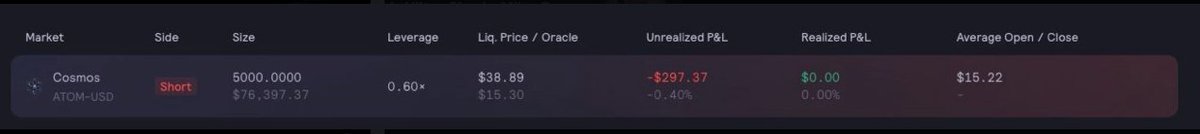
and here is our recorded entry at $15.22
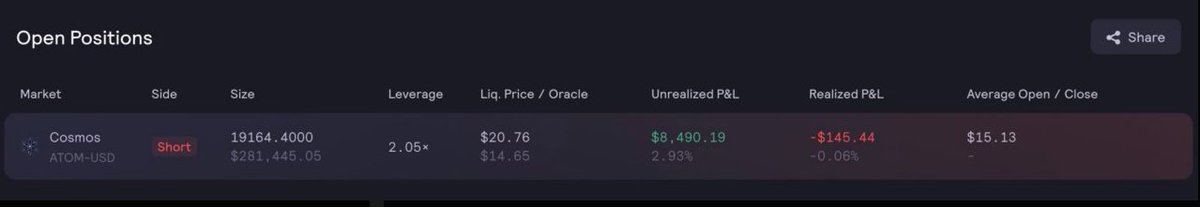
and our exit for a quick +$8.5k a few hours later at $14.65
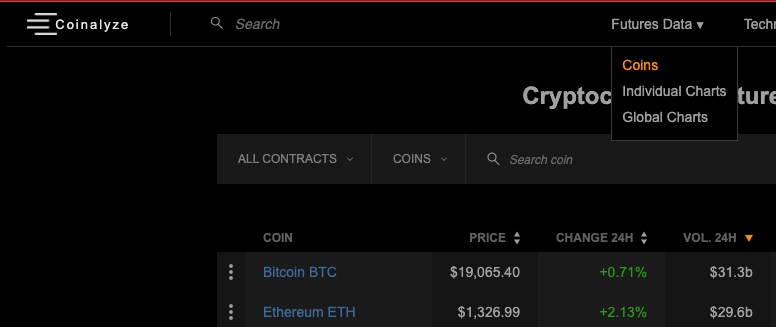
So to get this up and running first head to coinalyze.net > Futures Data > Coins
In this example, I'll choose $ETH
In this example, I'll choose $ETH
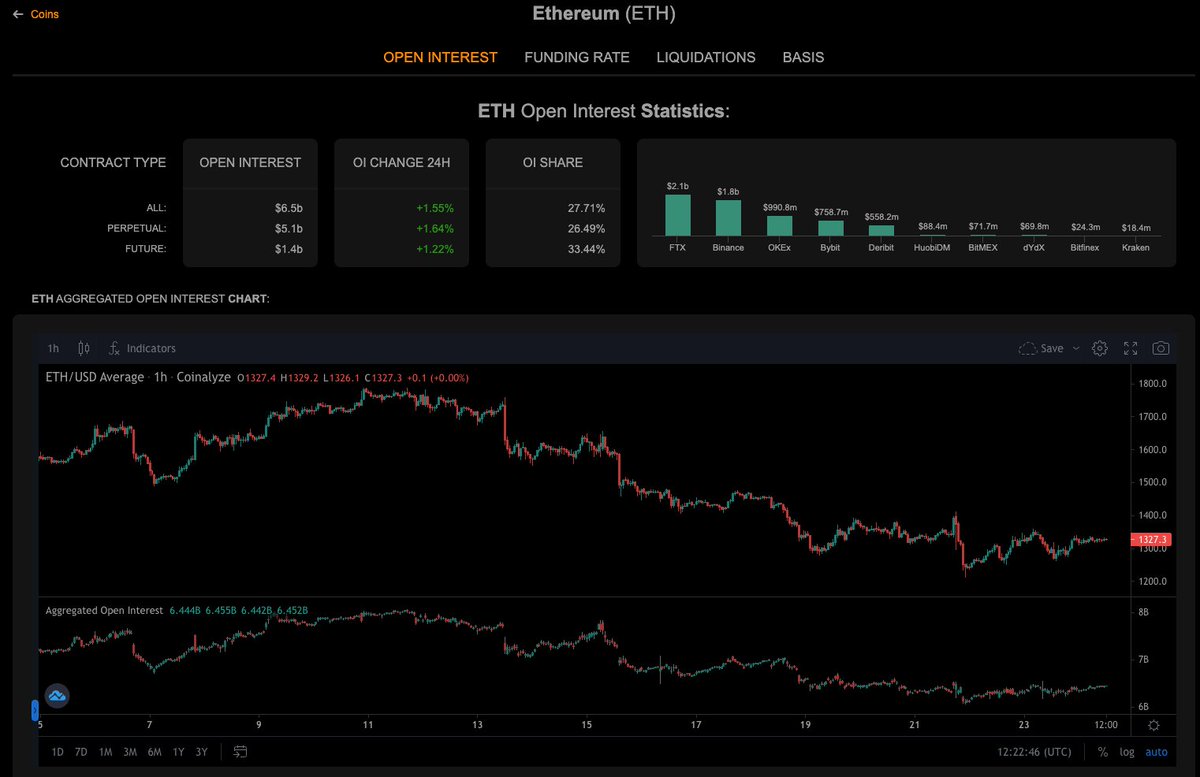
You'll land here, which is in itself useful as it shows aggregated OI across different exchanges. But to get that granularity we want, we'll have to scroll down a bit..
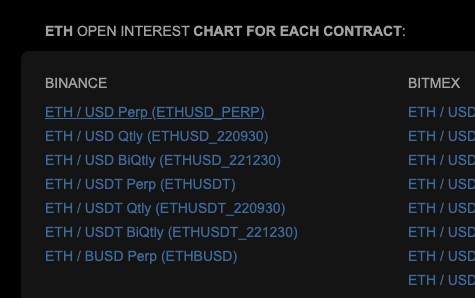
and pick a specific instrument on a specific exchange. I'm going to pick the Binance ETHUSD_PERP (the first one) since it's one of the most liquid and most frequently traded on Binance.
Now you're on this TradingView chart again, but the Indicators Tab will have a whole bunch of indicators that are only available on @coinalyzetool
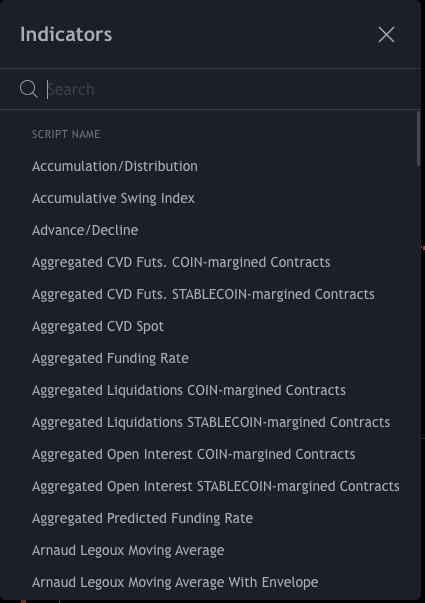
The ones we want to set up are the following:
- Volume
- Aggregated Open Interest STABLECOIN-margined
- Aggregated CVD Spot
- Aggregated CVD Futs. STABLECOIN-margined
- Predicted Funding Rate
- Aggregated Liquidations STABLECOIN-margined
- Volume
- Aggregated Open Interest STABLECOIN-margined
- Aggregated CVD Spot
- Aggregated CVD Futs. STABLECOIN-margined
- Predicted Funding Rate
- Aggregated Liquidations STABLECOIN-margined
You should end up with something like this.
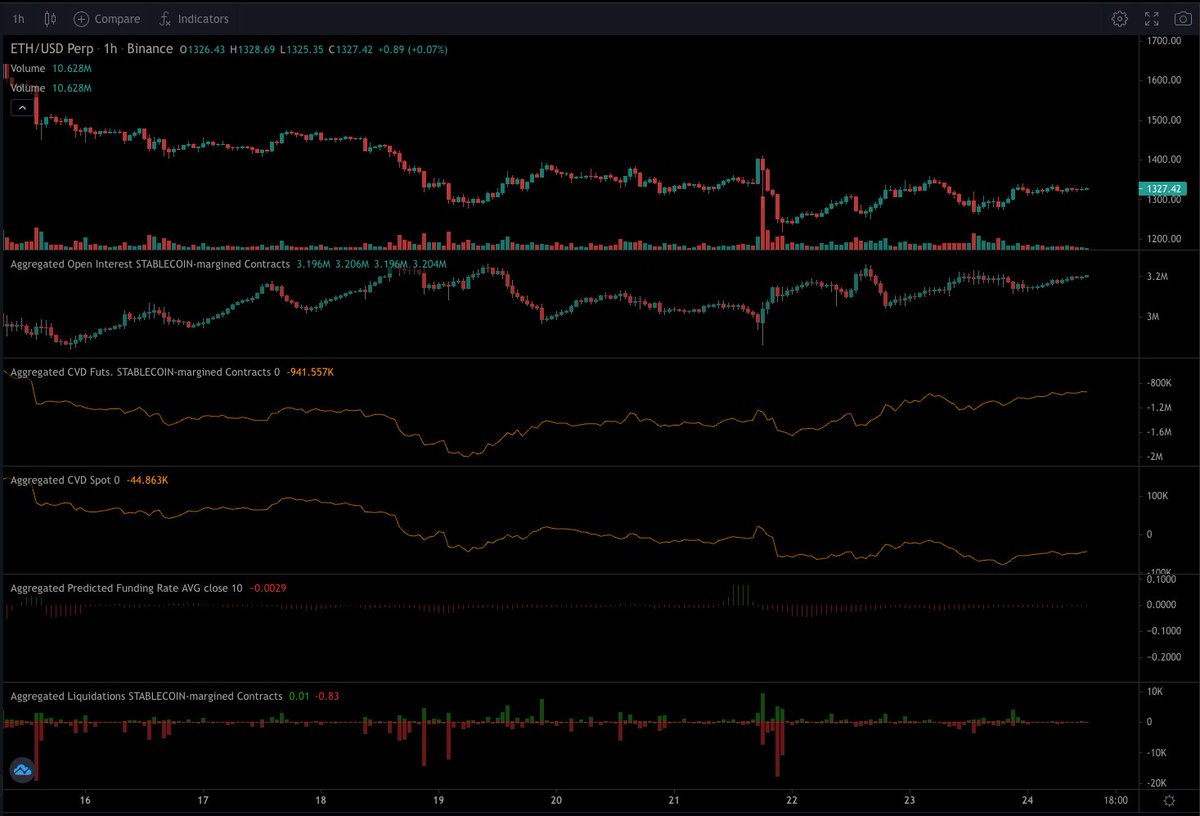
If you press the little settings/gear symbol, you can customise the "Style" of each indicator to get it looking how you want


A quick note on funding.. green means longs PAY funding to be long perps (everyone doing the same thing), and negative funding means that longs are getting PAID funding to be long (demand for shorts is high).

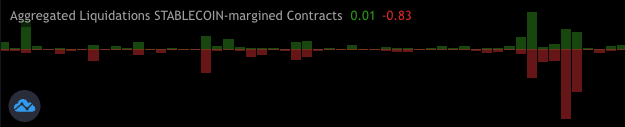
and the liquidations tab works like this:
-> green bar = number of shorts liquidated
-> red bar = number of longs liquidated
-> green bar = number of shorts liquidated
-> red bar = number of longs liquidated
Now I'm not going to spell out how to use each of these as a lot of this comes from experience and has to be used in conjunction with other context-specific things like Macro, event risk, what's happening on the higher time frame chart etc.
This data is most useful on LTF like the 5 min or 15 minute when planning an exit or entry. In general, look for signs of froth in OI, crowded funding positioning, spot deviating from what perps are doing, and a relatively quiet period of liquidations (calm before a storm?)
You'll notice these charts disappear and you'll have to set it all up again if you close the tab you're on. I have a premium account and I think it's worth it. But by now y'all know I ain't the kinda guy to shill a ref link so figure out if it's worth it for you.
Peace ✌️
Peace ✌️
• • •
Missing some Tweet in this thread? You can try to
force a refresh