COVID-19: Things everyone should know (Part 1: Immune System)
With poor public health messaging, the general public doesn't seem to know some important things about how COVID-19 and the immune system actually works. 🧵1/
With poor public health messaging, the general public doesn't seem to know some important things about how COVID-19 and the immune system actually works. 🧵1/
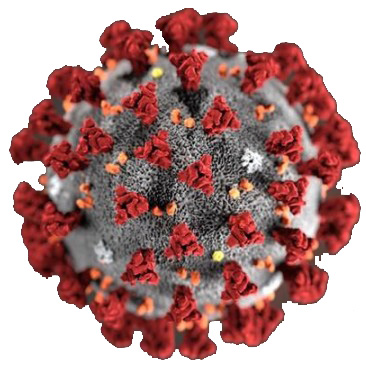
This thread will highlight some at a very high level without going into too much scientific jargon and references will be left for the end. 2/
Did you know that the COVID-19 virus (SARS-CoV-2) actually has the ability to actively suppress and hide from multiple parts of your immune system? Even if you have been vaccinated or previously infected, some immune cells that were trained to identify the virus will not see...3/
...that your cells are infected because the virus can turn off the early warning system of the infected cell to call for help. Normally your infected cells can trigger an alarm and immune cells will kill them, but have now become invisible. 4/
Not only that but the virus is pretty sneaky and sets up a secret compartment inside the cell to replicate where it can't easily be detected by some of the immune system sensors. 5/
That is one of the reasons why the COVID-19 vaccines don't completely prevent infection because the virus can hide long enough from your immune system to replicate in large enough numbers to be infectious to others even if you don't get seriously ill. 6/
The newer COVID-19 variants are getting better and better at suppressing and evading the immune system which is why so many people are becoming reinfected again. 7/
The current COVID-19 vaccines you get in your arm, generate blood antibodies throughout your body which provide protection in most organs but do not generate many antibodies in your nose and upper airway where the virus enters your body. 8/
It turns out you need local (mucosal) antibodies in these areas to protect your upper airway and brain from infection, which is another reason why the intramuscular vaccines do not completely stop infection. 9/
New nasal spray COVID-19 vaccines are being developed and now approved in some countries (India, China) that will generate these mucosal antibodies. You may have heard that vaccine protection "wanes" over time but what does that mean? 10/
When your immune system first encounters a new virus (whether you get infected or get your first vaccine dose) your immune system will generate antibodies to fight the virus and prevent them from infecting your cells. 11/
The first exposure takes longer to generate antibodies (10-20 days depending on type) so it takes a while to fight off the virus (or build immunity from a vaccine dose). Naturally over time the antibody levels drop after the virus is gone since your body can't use energy... 12/ 

...to keep high levels of antibodies for every pathogen it has ever encountered. Instead, it creates memory immune cells so it can create more antibodies to fight off the virus should you get exposed again. 13/
The next time your immune system encounters the same virus, it can respond much faster, mobilizing the memory cells to generate new antibodies and this time it only takes 3-10 days instead of 10-20 days. 14/ 

With COVID-19 actively suppressing and hiding from parts of the immune system, it can replicate long enough and fast enough for you to become infectious even if you were previously infected or vaccinated before the antibody levels get high enough to fight off the virus. 15/
Thankfully immune system memory can generate antibodies fast enough to protect most people from serious illness, even if it doesn't stop you from being contagious. 16/
Since immune memory takes time to build up antibodies when exposed to the virus, people have more protection from infection and severe disease when antibody levels are still relatively high so they can spring into action immediately. 17/
Antibody levels tend to hit their maximum levels within a month of getting exposed and then slowly decline over time with much faster declines between 4 and 6 months. 18/
This is why you typically see recommendations to get booster doses between 3 and 6 months after your last dose because antibody levels have decreased significantly by 6 months. 19/
What happens when you get multiple doses of vaccines? First, most of the vaccines people received as children to protect against other diseases needed multiple doses. 20/
Vaccines for measles, mumps, rubella, HPV, hepatitis B are all 2 doses, and Diphtheria, Tetanus, and Pertussis are all 4 dose vaccines, with tetanus needing a booster every 10 years. 21/
For the COVID-19 mRNA vaccines specifically, the first dose generates antibodies to a certain level and immune cells look at certain parts of the COVID virus spike that is given in the vaccine and memorize it. 22/
The second dose generates antibodies to an even higher level than the first, and the immune system memorizes even more parts of the spike protein. 23/
So far this has continued where subsequent doses generate higher and higher levels of antibodies which then take longer to decrease below a minimum threshold because they start out higher. 24/
Since the immune system continues to learn about different parts of the virus spike even though the virus has been mutating, it will still recognize the virus and generate a response, but antibodies are less effective against newer variants that have mutated significantly. 25/
Getting a booster dose after 6 months restores and likely increases your antibody levels to a higher level which temporarily provides more immediate protection should you be exposed to the virus again. 26/
The new bivalent booster doses also include one of the newer variants like BA.1 (Canada, UK) or BA.5 (USA) so your immune system will learn about some of the mutations and hopefully be able to identify new variants more easily. 27/
If you do get infected, do you know how long you are contagious for? Studies have found that with the Omicron variant, 75% of people they tested after 5 days from symptom onset were still contagious, 50% of people after 8 days, and 24% of people after 10 days. 28/
This is not just testing positive, but they actually cultured the virus to see if it was still viable and replicating. So that means if people only isolate for 24 hours or even 5 days after testing positive, they are likely still contagious and could be infecting others. 29/
Rapid Antigen Tests (RATs) are great for this purpose since they only test positive when there is a high viral load detected which means you are likely contagious. 30/
Have you heard or been told that tests can be positive for weeks or months after infection? That is the PCR test which amplifies the RNA signal and is usually done in a lab. 31/ 👇Click "Show Replies" to continue thread...
Since PCR tests can detect very low levels of virus, testing positive doesn't tell you if you are still contagious and can test positive long after you are no longer contagious. 32/
But since RATs testing positive almost always means you are contagious, they can be used to help see when you stop being contagious and then safely leave isolation. 33/
But... What you really want to do is prevent becoming infected in the first place. Each time you get infected or reinfected there is a chance you can develop long-term consequences or possibly permanent damage to your body as COVID-19 is not a cold. 34/
While being vaccinated can reduce the chance of developing Long COVID, even 1 in 10 vaccinated people who got infected developed Long COVID. 35/
Infection puts people at increased risk of heart attack, stroke, cardiovascular issues, blot clots, brain damage, neurological and many more issues even months after infection. This happens in both adults and children, and even with mild infections. 36/
This means that we can't rely on vaccines alone, but need to invest in additional measures that are variant proof. Part 2 will discuss how the virus is transmitted and ways to help reduce the risk of becoming infected. 37/
Immune System & Infection References:
- nature.com/articles/s4159…
- nature.com/articles/s4139…
- science.org/doi/10.1126/sc…
- science.org/doi/10.1126/sc…
- cell.com/immunity/fullt…
- nejm.org/doi/full/10.10…
- nejm.org/doi/full/10.10…
- biorxiv.org/content/10.110…
- biorxiv.org/content/10.110…
38/
- nature.com/articles/s4159…
- nature.com/articles/s4139…
- science.org/doi/10.1126/sc…
- science.org/doi/10.1126/sc…
- cell.com/immunity/fullt…
- nejm.org/doi/full/10.10…
- nejm.org/doi/full/10.10…
- biorxiv.org/content/10.110…
- biorxiv.org/content/10.110…
38/
- biorxiv.org/content/10.110…
- biorxiv.org/content/10.110…
- forbes.com/sites/williamh…
-
-
-
- health.gov.on.ca/en/public/prog…
- fda.gov/medical-device…
- cbc.ca/news/canada/to…
39/
- biorxiv.org/content/10.110…
- forbes.com/sites/williamh…
-
-
-
- health.gov.on.ca/en/public/prog…
- fda.gov/medical-device…
- cbc.ca/news/canada/to…
39/
Long COVID References:
- thelancet.com/journals/lance…
- nature.com/articles/s4159…
- nature.com/articles/s4159…
- nature.com/articles/d4158…
- academic.oup.com/ofid/advance-a…
- ft.com/content/26e073…
- financialpost.com/executive/exec…
- scientificamerican.com/article/even-m…
40/
- thelancet.com/journals/lance…
- nature.com/articles/s4159…
- nature.com/articles/s4159…
- nature.com/articles/d4158…
- academic.oup.com/ofid/advance-a…
- ft.com/content/26e073…
- financialpost.com/executive/exec…
- scientificamerican.com/article/even-m…
40/
- jamanetwork.com/journals/jama/…
- publichealth.jhu.edu/2022/covid-and…
- pnas.org/doi/10.1073/pn…
- fortune.com/2022/08/04/cov…
41/
- publichealth.jhu.edu/2022/covid-and…
- pnas.org/doi/10.1073/pn…
- fortune.com/2022/08/04/cov…
41/
For people who want a web link to share, you can find it here: threadreaderapp.com/thread/1573772…
Part 2 of this thread on transmission and protection is now available here:
https://twitter.com/jeffgilchrist/status/1574709291520593923
• • •
Missing some Tweet in this thread? You can try to
force a refresh


