
$BTC #Bitcoin
Is the bottom of Bitcoin in, or not?
In this thread, I would like to update you with charts and on-chain analysis on this topic, since my last thread was more than 3 months ago.
1/14
Is the bottom of Bitcoin in, or not?
In this thread, I would like to update you with charts and on-chain analysis on this topic, since my last thread was more than 3 months ago.
1/14

$BTC #Bitcoin
If you ask me, this is one of the most important trendlines for Bitcoin (for the last 5 years).
Every time $BTC has broken through it (whether down or up), the price fluctuations have been very volatile afterwards.
For now, the line is holding.
2/14
If you ask me, this is one of the most important trendlines for Bitcoin (for the last 5 years).
Every time $BTC has broken through it (whether down or up), the price fluctuations have been very volatile afterwards.
For now, the line is holding.
2/14

#Bitcoin
This chart shows quite clearly that structures can always repeat themselves. It doesn't matter, whether it is inverse, other timeframes, or other assets.
Left= $BTC '18-'21.
Right=Inverse-Chart $BTC '21-'22.
We should see a reversal very soon.
3/14
This chart shows quite clearly that structures can always repeat themselves. It doesn't matter, whether it is inverse, other timeframes, or other assets.
Left= $BTC '18-'21.
Right=Inverse-Chart $BTC '21-'22.
We should see a reversal very soon.
3/14

$BTC #Bitcoin
Inverted chart of Bitcoin.
$BTC touched this trend line not so often. This is only the third time in 7 years.
Could this be a turning point?
If so, I am targeting the red dotted line (>100K), before we slide into a major crash.
4/14
Inverted chart of Bitcoin.
$BTC touched this trend line not so often. This is only the third time in 7 years.
Could this be a turning point?
If so, I am targeting the red dotted line (>100K), before we slide into a major crash.
4/14

$BTC #Bitcoin
Had already mentioned this.
2014/2015 Top to Bottom = 426 Days
2021/2022 Top to Bottom = 426 Days
5/14
Had already mentioned this.
2014/2015 Top to Bottom = 426 Days
2021/2022 Top to Bottom = 426 Days
5/14

#Bitcoin
One of my favourites: Mayer Multiple Bands (MMBs).
As you can see, we touched the 🟠 line only in the Covid Crash (exceptional situation=very volatile).
Otherwise, $BTC has never broken the 🟠 line.
This area has always been an optimal buying opportunity
6/14
One of my favourites: Mayer Multiple Bands (MMBs).
As you can see, we touched the 🟠 line only in the Covid Crash (exceptional situation=very volatile).
Otherwise, $BTC has never broken the 🟠 line.
This area has always been an optimal buying opportunity
6/14

$BTC #Bitcoin
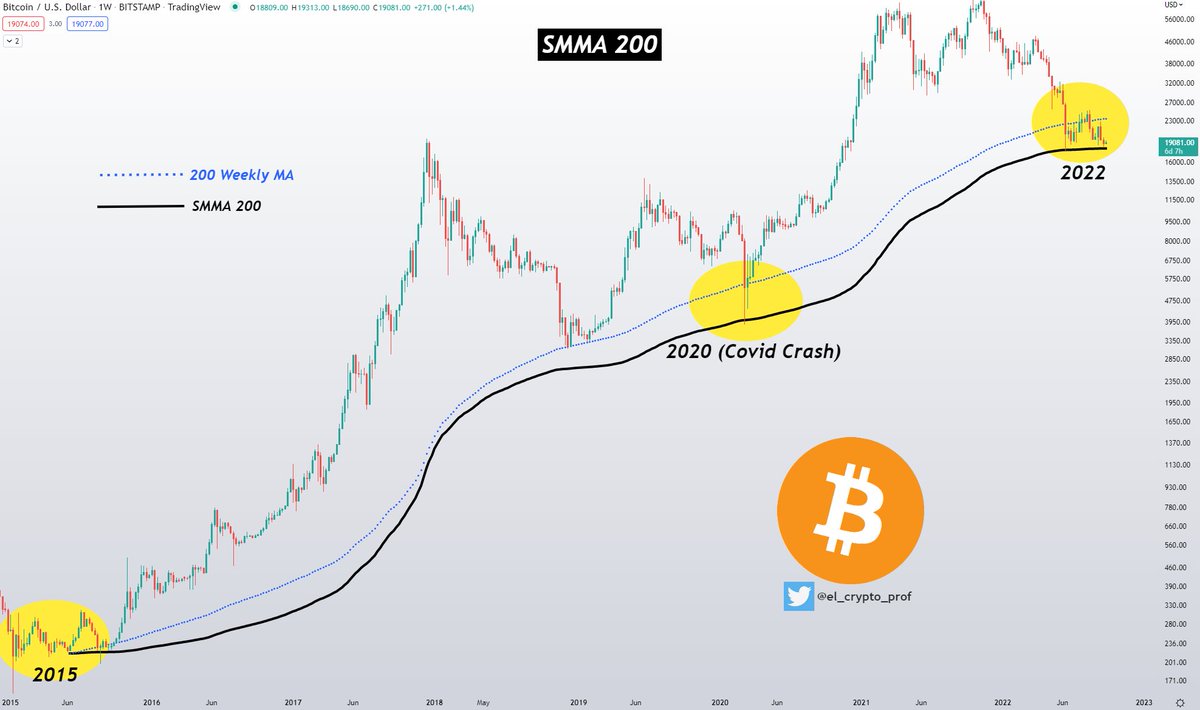
Yes, the 200 Weekly MA is great and has proven many times over the years that it was a good decision, to buy in this area.
But have you heard of the SMMA 200?
It was very accurate in 2015, 2020 and $BTC is at that line again now.
$BTC has never broken it.
7/14
Yes, the 200 Weekly MA is great and has proven many times over the years that it was a good decision, to buy in this area.
But have you heard of the SMMA 200?
It was very accurate in 2015, 2020 and $BTC is at that line again now.
$BTC has never broken it.
7/14
$BTC #Bitcoin
Gaussian Channel:
I had already told you in June that the ultimate low of $BTC always happened at the beginning of the red channel.
So far, it's been repetitive.
To me, it looks like $BTC is forming a channel here, as in previous years.
8/14
Gaussian Channel:
I had already told you in June that the ultimate low of $BTC always happened at the beginning of the red channel.
So far, it's been repetitive.
To me, it looks like $BTC is forming a channel here, as in previous years.
8/14

$BTC #Bitcoin
Bitcoin Rainbow Price Chart:
Since 2012, this chart has been one of the best tools, to figure out which levels are good to buy or sell.
$BTC is currently at a level, like the 2020 Covid Crash, where it fell out of the blue area for a few days.
9/14
Bitcoin Rainbow Price Chart:
Since 2012, this chart has been one of the best tools, to figure out which levels are good to buy or sell.
$BTC is currently at a level, like the 2020 Covid Crash, where it fell out of the blue area for a few days.
9/14

$BTC #Bitcoin
Fear & Greed Index:
As I said last time - this picture is self-explanatory.
If you look closely, it looks very similar to 2019.
Accumulation, before a leg up.
10/14
Fear & Greed Index:
As I said last time - this picture is self-explanatory.
If you look closely, it looks very similar to 2019.
Accumulation, before a leg up.
10/14

$BTC #Bitcoin
In my opinion, the puell multiple chart is one of the best on-chain charts, when it comes to finding the bottom for $BTC.
In recent years, it has fallen into the green zone first and then tested this area a second time, before making the next run up.
11/14
In my opinion, the puell multiple chart is one of the best on-chain charts, when it comes to finding the bottom for $BTC.
In recent years, it has fallen into the green zone first and then tested this area a second time, before making the next run up.
11/14

#Altcoins //TotalMarketCap
I have shared this chart the first time, at the beginning of the year and it still runs 100% according to plan.
I think Altcoins will experience a run that many haven't seen before.
12/14
I have shared this chart the first time, at the beginning of the year and it still runs 100% according to plan.
I think Altcoins will experience a run that many haven't seen before.
12/14

$BTC #Bitcoin
Is the Bottom in, or not?
As I said last time, finding the exact bottom of Bitcoin is like winning the lottery.
However, you can see that all the charts I shared last time, continue to suggest that we have already seen the bottom of $BTC.
13/14
Is the Bottom in, or not?
As I said last time, finding the exact bottom of Bitcoin is like winning the lottery.
However, you can see that all the charts I shared last time, continue to suggest that we have already seen the bottom of $BTC.
13/14
$BTC #Bitcoin
I still believe that after this crash/correction, we will see a longer upward phase, before we get into a real recession, with a major crash that will last for years.
14/14
Feel free to follow me on twitter:
@el_crypto_prof
or Telegram: t.me/MoustacheTA
I still believe that after this crash/correction, we will see a longer upward phase, before we get into a real recession, with a major crash that will last for years.
14/14
Feel free to follow me on twitter:
@el_crypto_prof
or Telegram: t.me/MoustacheTA
• • •
Missing some Tweet in this thread? You can try to
force a refresh


