
We are seeing multiple variants with convergent evolution that will drive the next wave.
All variants with 5+ key RBD mutations can be grouped together, I am referring to this group as "Pentagon" for sharing the 5 mutations.
Thank you @CorneliusRoemer for covspectrum collection
All variants with 5+ key RBD mutations can be grouped together, I am referring to this group as "Pentagon" for sharing the 5 mutations.
Thank you @CorneliusRoemer for covspectrum collection
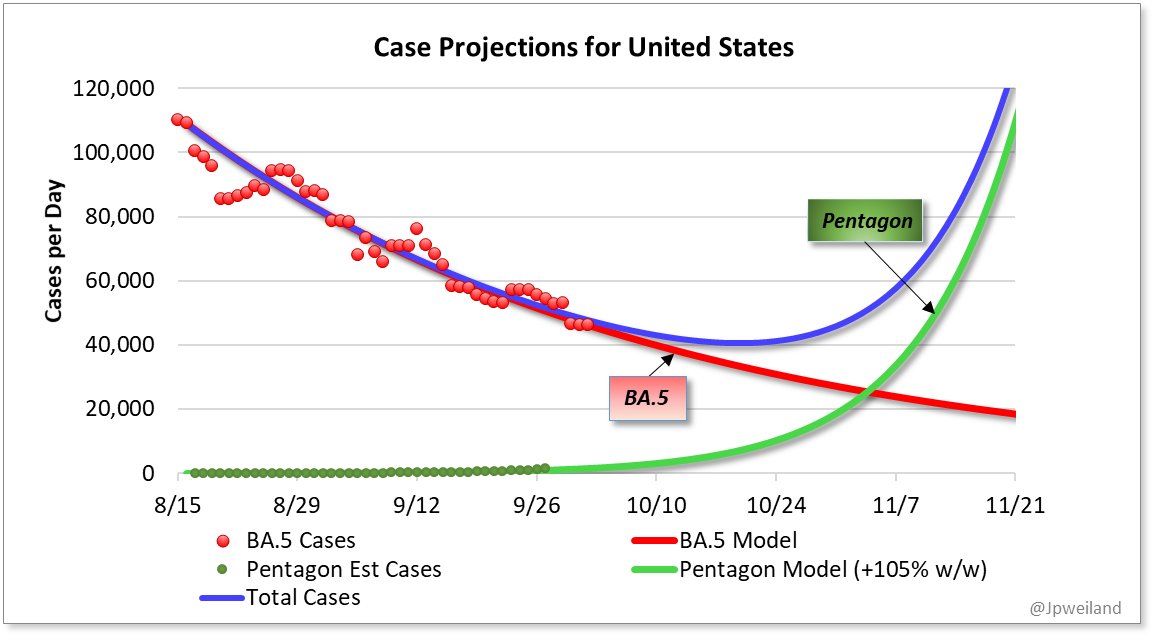
@CorneliusRoemer Evaluating the rate of increase of spectra worldwide with these mutations shows very clear, steady log growth, currently estimated at +105% week/week over BA.5

This phase of the pandemic is different than we've seen in the past, with the same advantageous mutations popping up all over instead of saltation (leaping) evolution. @shay_fleishon has a great, detailed thread
https://twitter.com/shay_fleishon/status/1576649685980225536
Instead of keeping track of a half dozen or more different variants with different names seems cumbersome for communications and evaluation. Logical grouping of similar evolutions makes sense at this point. Since it is a group, a different naming system seemed appropriate
Many thanks to the hard work of survalence team @PeacockFlu @TWenseleers @LongDesertTrain @trvrb @RajlabN @EricTopol @Mike_Honey_ @jbloom_lab @florian_krammer @EllingUlrich and others, as well as the boots-on-the-ground scientists around the world feverishly sequencing samples!!
How big will the peak of this covid wave be?
It's hard to say at this point. I'm confident it won't be near the size of the January Omicron wave, but it could reach or surpass BA.5 wave peak. Difficult to estimate the amount of herd resistance to Pentagon in the population.
It's hard to say at this point. I'm confident it won't be near the size of the January Omicron wave, but it could reach or surpass BA.5 wave peak. Difficult to estimate the amount of herd resistance to Pentagon in the population.
So which lineages are included in Pentagon?
BQ.1.1
BN.1
XBB
BA.2.75.2*
And a number of others with small sequence counts.
Variant soup
BQ.1.1
BN.1
XBB
BA.2.75.2*
And a number of others with small sequence counts.
Variant soup
This particular model does not consider effects of background forces (shift to fall weather, behavioral changes, vaccine uptake etc).
Influx of cold weather pushing more people indoors could shift the upswing a bit earlier, mainly in northern states
Influx of cold weather pushing more people indoors could shift the upswing a bit earlier, mainly in northern states
Regardless, the arrival of #Pentagon variants will be the main driver of case increases from their significant transmission advantages
@CorneliusRoemer Meet the #PentagonVariants
All the highlighted variants below are Pentagon, with 5 or more key escape mutations. The immune evasion even from BA.5 infection is impressive on all of them. Small numbers=more Immune evasion
All the highlighted variants below are Pentagon, with 5 or more key escape mutations. The immune evasion even from BA.5 infection is impressive on all of them. Small numbers=more Immune evasion
https://twitter.com/yunlong_cao/status/1577343549120872448

An additional escape mutation is now being included in all of the Pentagon Variants. #Pentagon or #Hexagon, either name, they are the same set of variants
https://twitter.com/CorneliusRoemer/status/1578417266672439296
• • •
Missing some Tweet in this thread? You can try to
force a refresh


