(1/n) I love telling stories with data and I have recently discovered #gganimate as a way to take my #dataviz to the next level.

gganimate.com
Here is some sample code to generate a random walk, create a line plot, and layer in the animation. I love how it's simple to layer within the #ggplot2 framework. Image
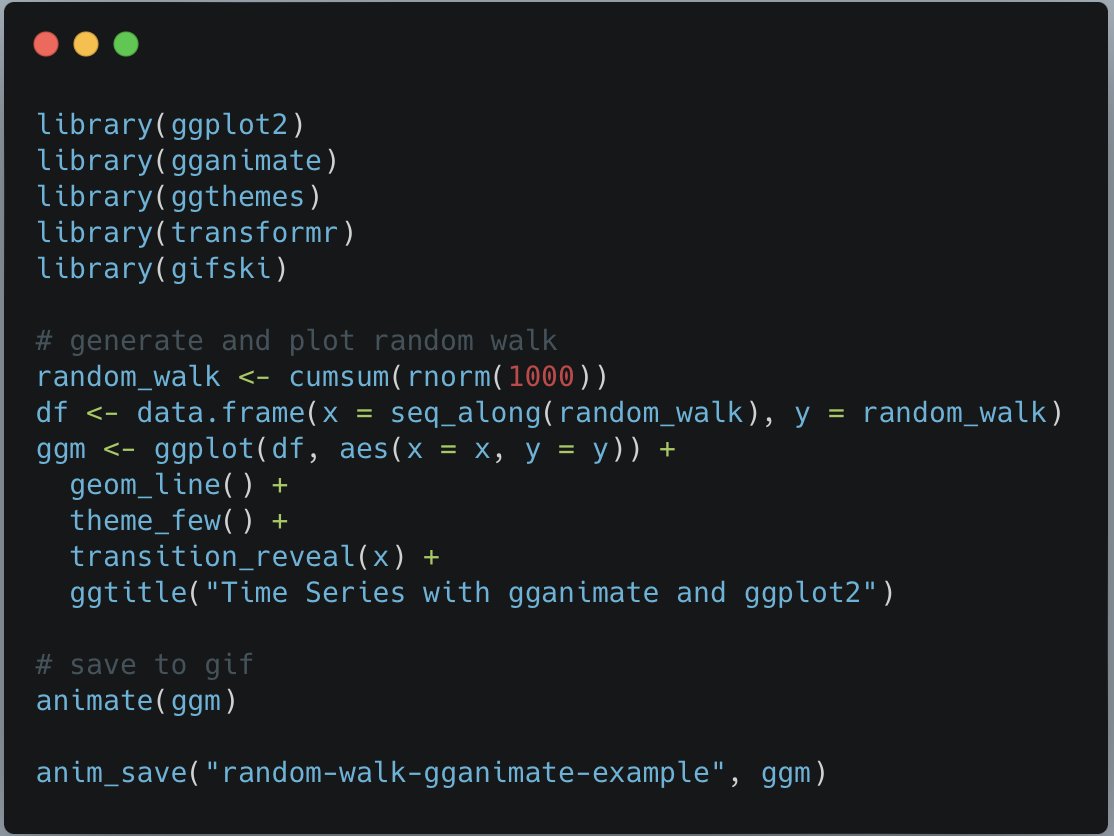
(3/n) Here is the resulting plot! using the `transition_reveal()` it keeps the previous points on the graph, but it is highly configurable. For example, I could use `transition_time()` or `transition_state()` to only show the point being added.
(4/n) I initially had some trouble getting the gif to render, so I added the gifski library based on this stack overflow post; stackoverflow.com/questions/5898…
(5/n) I also had some trouble using with geom_line for the first time, as my previous forays with gganimate used geom_point without issue. I was able to address based on this GitHub issue to add the transformr library

github.com/thomasp85/ggan…
(6/n) I love love love love using #ggthemes so this link was helpful to understand the catalog of themes available

yutannihilation.github.io/allYourFigureA…

And this link helped me generate the random walk plotly.com/ggplot2/random…
(7/7) TL;DR gganimate is so much fun! and there are a lot of online resources available with examples with a simple google search.

What use cases have you had for gganimate?

#rstats #gganimate #ggplot2

• • •

Missing some Tweet in this thread? You can try to force a refresh
 

Keep Current with We are R-Ladies

We are R-Ladies Profile picture

Stay in touch and get notified when new unrolls are available from this author!

Read all threads

This Thread may be Removed Anytime!

PDF

Twitter may remove this content at anytime! Save it as PDF for later use!

Try unrolling a thread yourself!

how to unroll video
  1. Follow @ThreadReaderApp to mention us!

  2. From a Twitter thread mention us with a keyword "unroll"
@threadreaderapp unroll

Practice here first or read more on our help page!

More from @WeAreRLadies

Oct 11
(1/n) All about Shiny. My go to approach for building shiny apps is finding an example I like, going to the github to review the code, and retrofitting it for my use case (w/ credits!).

shiny.rstudio.com/gallery/
(2/n) I learned this approach via an online course where we deployed models via Shiny to show performance. It was daunting at first and my first foray into building an application.

If you are just getting into Shiny and feel overwhelmed, you've got this & keep at it.
(3/n) Version control & Peer review: Something I like about code based dashboards (vs. low/no code solutions) is that it version control becomes possible via git, and dashboards that require complicated calculations are more visible/transparent in a single script.
Read 10 tweets
Oct 7
(1/n) I'm sure that there are tons of #DataViz & #rmarkdown tips & tricks out there. So in this thread, I would just like to share a bit of my coding adventures. 🤓💻
(2/n) Before discovering the wonderfulness of ggplot2, my figures were confined to the "limits" of MS Excel. While it is definitely possible to create coherent plots in Excel, it does get kinda clunky when you have more complex data. And what about overlaying my plots?? 🤨
(3/n) Cue ggplot2! Its super intuitive, customizable & compatible with tons of extensions that "enhances" one's plotting capabilities.

I've also been using @CedScherer AMAZING guide, which takes your plots to a whole other level. 🤩
cedricscherer.com/2019/08/05/a-g…
Read 6 tweets
Oct 6
(1/n) Let's touch a bit on analysing social media data with R. I've dabbled in this a little, mostly for Twitter data.

Thanks to @TwitterDev, you can apply for Academic Research Access (developer.twitter.com/en/products/tw…) to gather data through their API endpoints. How neat is that!
@TwitterDev (2/n) There are a couple of packages for downloading and working with Twitter data.

So far, I've been using academictwitteR, which has super useful vignettes and straight forward functions!

cran.r-project.org/web/packages/a…
@TwitterDev (3/n) Here's a simple demonstration! After setting your tokens (see cran.r-project.org/web/packages/a…), use get_all_tweets() to obtain tweets based on your queries.

Here I'm getting tweets from @WeAreRLadies in December 2021 😊 R codes for downloading and viewing tweets with the academic
Read 4 tweets
Oct 6
(1/n) Why do we do literature reviews? Apart from it forming a PhD chapter (as most of us would kinda have to do), literature reviews give us an overview of our research topic(s). Talking about the INs and OUTs of Topic XYZ~ 📚📖📑

Cartoon by @twisteddoodles
@twisteddoodles (2/n) Well, instead of manually downloading and trawling through every single paper (really??), did you know that you can use R for literature reviews?

An example is litsearchr by @ElizaGrames. Check out it's amazing versatilities here! elizagrames.github.io/litsearchr/
@twisteddoodles @ElizaGrames (3/n) There are many more packages too. Here are a couple that I've come across:

More by @ElizaGrames
synthesisr
topictagger
metaverse

other packages:
bibliometrix
revtools
Adjutant
metagear

More links:
elizagrames.github.io/litsearchr/lit…
bibliometrix.org/vignettes/Intr…
scientificallysound.org/2022/03/22/met…
Read 4 tweets
Oct 5
(1/n) It's time for some dung beetle "juicy-ness" again~

My first attempt at using R for spatial data is to map the occurrences of dung beetles in Sabah, Malaysia and Singapore! Image showing the maps of Singapore and Sabah, Malaysia. It
(2/n) If you would like some background as to what motivated this, check out our cool GBIF-funded project here! 😎gbif.org/project/BIFA6_…
(3/n) My ambitious goal was to make the occurrence maps interactive! With some googling, I found many resources using Leaflet, an open-source JavaScript library for interactive mapping. Best of all, the leaflet R package is super versatile and allows for easy map customizability.
Read 6 tweets
Oct 5
(1/n) Today's topic is working with spatial data in R! TBH I'm pretty new to this and my spatial data experience has mostly been with using GIS software like ArcGIS, QGIS.

It was only this year where I really started dabbling in using R for spatial data mapping. 🗺️📌 Image of a woman thinking about spatial maps and spatial dat
(2/n) While prepping for today's topic, I came across this amazing guide (geobgu.xyz/presentations/…).

What really caught my attention is the history of spatial analysis in R and that R's capabilities in handling spatial data is increasingly improving! 🤩
(3/n) What I really like about using R for spatial data is that its a single environment for data processing, analysing and mapping

I can also use other packages for data manipulation etc before translating them into spatial objects with more specific spatial packages. 🤓
Read 5 tweets

Did Thread Reader help you today?

Support us! We are indie developers!


This site is made by just two indie developers on a laptop doing marketing, support and development! Read more about the story.

Become a Premium Member ($3/month or $30/year) and get exclusive features!

Become Premium

Don't want to be a Premium member but still want to support us?

Make a small donation by buying us coffee ($5) or help with server cost ($10)

Donate via Paypal

Or Donate anonymously using crypto!

Ethereum

0xfe58350B80634f60Fa6Dc149a72b4DFbc17D341E copy

Bitcoin

3ATGMxNzCUFzxpMCHL5sWSt4DVtS8UqXpi copy

Thank you for your support!

Follow Us on Twitter!

:(