I was keen to do something to celebrate the folks who use #rstats behind the scenes in the #NHS - building something with R to do so felt fitting!
Plus, I learnt more #quarto in the process!
@quarto_pub First step for me in doing something like this: Figma. It's a really useful tool for playing around with a layout before you try to implement it in code.
Here's the basic layout I built to figure out where everything should go.
Dec 2, 2022 • 12 tweets • 12 min read
Day 5: A worked example pulling all this together to build an Rmd-to-pdf template (using📦 {pagedown}) for @R_Girls_School!
There will be very little code in this one, because we're eagerly awaiting the Quarto-to-pdf equivalent, so I'm focusing instead on the principles I used. @R_Girls_School Rewind. I first heard about @R_Girls_School at the @NHSrCommunity conference, where the head teacher of Green Oak Academy, Dr Razia Ghani, came to share how they'd been teaching #rstats skills as part of lessons based on key subject of the curriculum (maths, geography, etc).
Nov 30, 2022 • 14 tweets • 9 min read
Day 3: Writing functions to create parameterised graphs
So, we've picked our colours and set up a nice theme. We already know we want to apply this to all our plots but what if we could reuse the same plot code across different bits of the data?
Easy, let's make a function!
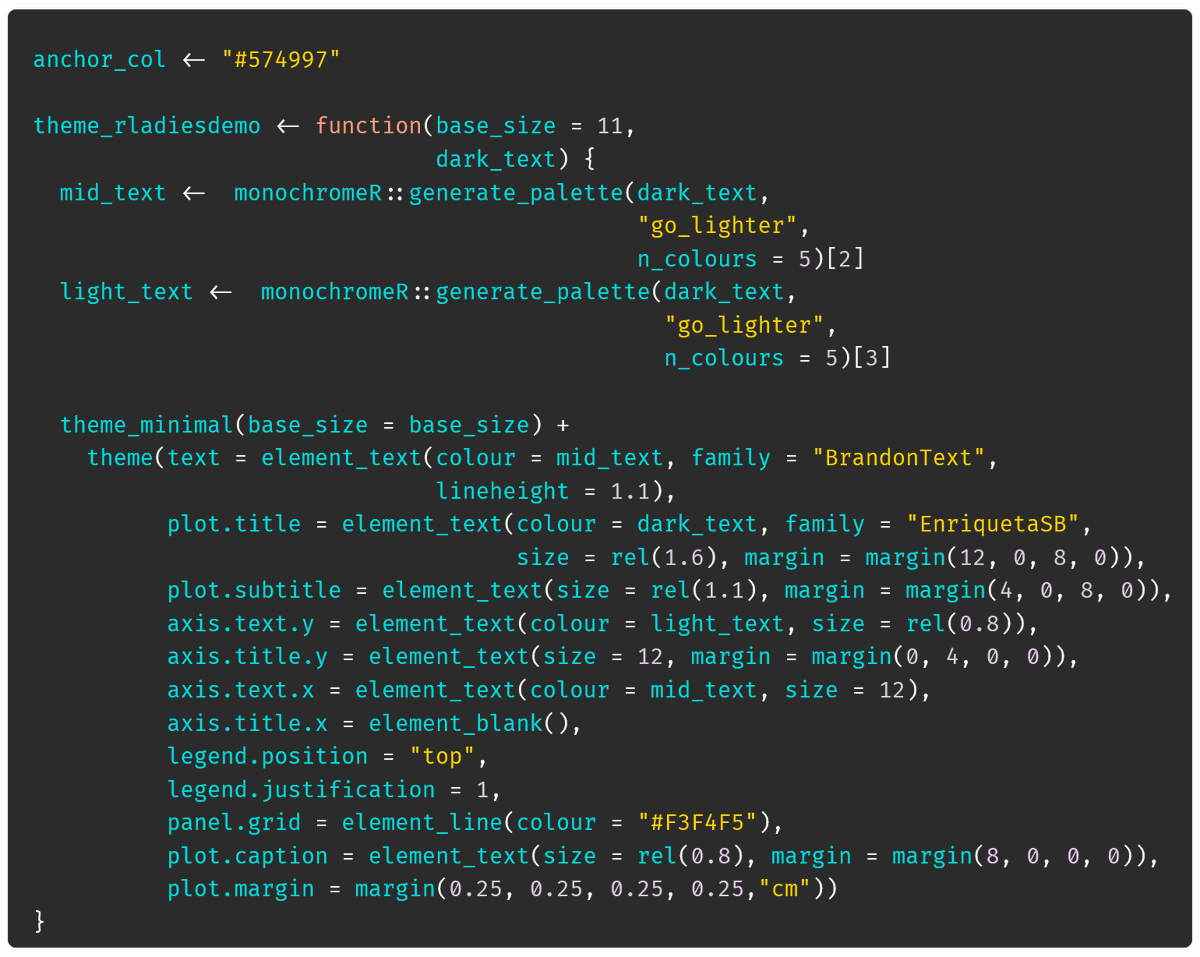
First, let's set up our plot. We're going to plot the number of penguins from each species within our dataset. We're using ggchicklet::geom_chicklet(), an anchor colour which is a blend of the blue and purple I mentioned on Day 1 and theme_rladiesdemo() which we built on Day 2.
Nov 29, 2022 • 9 tweets • 8 min read
2) Fonts. Picking fonts can be really tricky, but there are some really great resources out there (see below, where we're back to our "let others help you" mantra!).
Here, I've simply applied the fonts from my own website, changing the family element of element_text(). 3) Text size. You can manipulate text size within theme() either by setting absolute sizes (e.g. size = 16), or relative sizes (e.g. size = rel(1.2)).
The relative size is a good idea if you're going to reuse this theme: change the base size as needed and everything follows!
Nov 29, 2022 • 14 tweets • 11 min read
Day 2: Building your very own ggplot theme.
Here are three reasons why I think you should do this:
- Help orient your readers with text hierarchy
- Give everything some space to breathe
- Achieve effortless consistency with one extra line of code
Sound good? Let's dig in!
My starting point for creating a custom theme is typically theme_minimal(). It has sensible defaults such as relative text size and margins that we can build on, by just replacing some elements.
plot +
theme_minimal() +
theme(customise here)
Here's our plot with theme_minimal()
Nov 28, 2022 • 13 tweets • 8 min read
Day 1: Setting up a bespoke colour scheme 🎨
🤫 I'm going to let you in on a secret... I find picking colours really tricky! Thankfully, I've found few ways round that.
My top tip is to let others help you! But first, a broad principle...
When picking colours for story telling, I try to make the colours as intuitive as possible.
Here's the adventure I took the Palmer Penguins on in a recent talk involving the #GreatPenguinBakeOff. See if you can guess the details. (The next tweet should give you a few clues!)
Nov 28, 2022 • 5 tweets • 1 min read
Hi folks! I'm Cara, an Edinburgh-based freelance data consultant, and I'm excited to be bringing you a week of #rstats content based around the things I enjoy creating the most: data visualisations and "enhanced" reproducible outputs.
Over the course of the week, we'll be exploring the different components that go into making a nice "branded" parameterised report, each day building on the days before until we get to our finished product: a parameterised celebration of RLadies within the NHS.
Here's the menu:
Nov 11, 2022 • 11 tweets • 3 min read
Today I'd like to share how I debug R code, highlighting some neat RStudio tools and tricks. It's not a linear process so this thread isn't exactly in order. 1/n
It may sounds silly, but first, I take a breath & *fully* read the error/warning message. The breath is because it may not be the first error of the day & I might be getting frustrated. The careful reading is because I want all available information before moving ahead. 2/n
Nov 10, 2022 • 9 tweets • 3 min read
This morning, I'll share some tips for my favorite thing to do in R: make plots! I'm firming in the ggplot world so many tips are related to this and related packages.
So not surprisingly, my first tip is to checkout ggplot! I think the most powerful aspect it it's legends as they are created automatically and change as you change the plot. No fear of an incorrect legend!
This afternoon I'd like to highlight a recent project that I'm very proud of! My team developed a data analysis R package called **kimma** or Kinship In Mixed Model Analysis. Yes, it's also a play on my name and the well-known package limma 1/n
kimma provides flexible modeling of RNAseq data where you have many responses (genes) tested against the same model. You can run simple linear or mixed effects models with covariates, weights, random, & (new with this package) covariance effects like genetic kinship 2/n
Nov 9, 2022 • 6 tweets • 2 min read
It's tip time again! Here are my tips for working reproducibly in R.
Rprojects: This is a self contained directory with all data, scripts, etc necessary for an analysis. Within a project, you don't need file paths; thus, you can move the project & others can reproduce it.
Rmarkdown: This allows you to make reproducible reports with varying levels of detail from all the code to none of the code. I love that I can use the same document to make what I show to other bioinformaticians & to my non-coding bosses.
Nov 8, 2022 • 4 tweets • 2 min read
This week for #TidyTuesday, I explored K12 school run radio stations. I was interested in where these stations are located and what types of music they play. Shout out to my favorite station @c895radio with their dance music in Seattle! @c895radio My process:
- Explore the data & determine what questions I can address with a plot
- Filter data for school-associated stations & get geo data
- Plot the US & put dots for each station
- Color stations by simplified music genre groups
- Customize colors, background, etc
Nov 1, 2022 • 9 tweets • 3 min read
I love using and teaching R. For a while I was an adjunct faculty member, and I taught MFA students about data viz and R. It was so much fun! I always learn new things when I teach.
Based on my experience learning and teaching R, here are my five tips for learning R. (1/8)
1. Make mistakes. Mistakes help you learn. Even though I’ve been coding and using R for many years, I consistently run into errors and make mistakes when I code, and I always learn new things. (2/8)
Nov 1, 2022 • 5 tweets • 3 min read
Happy Tuesday! Today I'm going to share a little more about my R journey.
I first learned R through a statistics class and book in college. Then I learned more about it in my second full-time job as a statistician in market research by reading and using another person's code.
I got really into doing data viz in R after I joined my local R-Ladies chapter (@RLadiesTucson) in 2020 and started participating in weekly #TidyTuesday sessions.
Oct 31, 2022 • 5 tweets • 2 min read
Hi everyone! I'm Jenn, and I'm super excited to be curating #RLadies this week! I've worked in data/data science for about 10 years, and I love R! I mainly use R for data viz and analysis. (1/5)
This week I'll be talking about #DataViz and learning #RStats. I learned R first in grad school and then on the job when I worked as a statistician. (2/5)
Oct 19, 2022 • 8 tweets • 2 min read
(1/n) Since Halloween is just around the corner, let's talk about something spooky: presentations with LIVE CODING 🎃👻😱. To prepare for a 2-hour virtual workshop on package development, I came up with a system to help me stay organized.
Here's what helped⬇️
(2/n) First, what is it about live coding that makes it tricky? IMO it’s the amount of context switching. You need to keep the audience engaged while juggling an array of different apps (e.g. web browser, IDE, terminal). More apps = more unexpected things possibly happening.
Oct 19, 2022 • 7 tweets • 5 min read
(1/n) A fun and practical idea for an R package: a #ggplot2 extension to modify plots so they adhere to an organization’s visual identity 📊📈📉⬇️
(2/n) A visual identity allows an entity to be instantly recognized. Made up of their logo, typography, and colors, it can be applied when creating external or internal communications. For example, here’s the visual building blocks of my alma mater @UBC: bit.ly/3EN0oNs
Oct 18, 2022 • 6 tweets • 2 min read
(1/n) Think that your team's workflow could benefit from a custom R package but don't know where to start?
Here's a list of steps that helped me when I was embarking on my package development journey at my previous workplace ⬇️
(2/n) First, identify your team's needs. Are there any pain points that could be alleviate with code?
I chose to send out a questionnaire to formulate a team-wide wish list of functions they'd like to see in the communal toolbox 🧰
For each function, I asked for the following:
Oct 18, 2022 • 7 tweets • 5 min read
(1/n) Last year, I led workshops on package development with the help of @RLadiesVan and @RLadiesSeattle. I often find it helpful learning why a tool is useful before diving into how to use it, so I began each workshop by motivating why you might want to try creating a package:
@RLadiesVan@RLadiesSeattle (2/n) I’ll write a few lines of code to accomplish a specific task. Later, I'll often find that the code chunk is rather applicable to other situations. I might copy and paste the relevant lines of code and repurpose it by changing a few characters here and there.
Oct 15, 2022 • 5 tweets • 4 min read
(1/n) Getting data can be difficult when trying to work on an open source project for your blog/portfolio/fun and to practice your R skills! Here are some resources to get started:
(1/n) All about Shiny. My go to approach for building shiny apps is finding an example I like, going to the github to review the code, and retrofitting it for my use case (w/ credits!).
shiny.rstudio.com/gallery/
(2/n) I learned this approach via an online course where we deployed models via Shiny to show performance. It was daunting at first and my first foray into building an application.
If you are just getting into Shiny and feel overwhelmed, you've got this & keep at it.