Jamie Coutts CMT Profile picture
Oct 13, 2022 14 tweets 10 min read Read on X
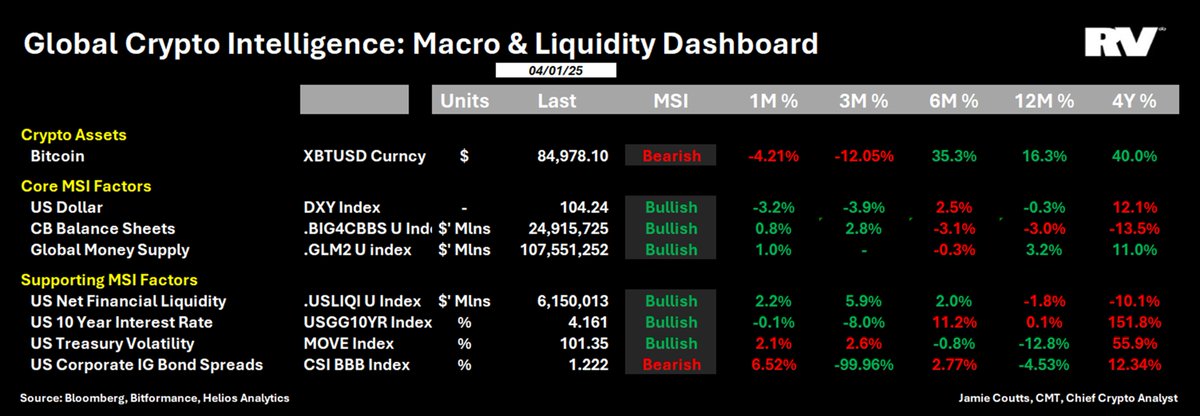
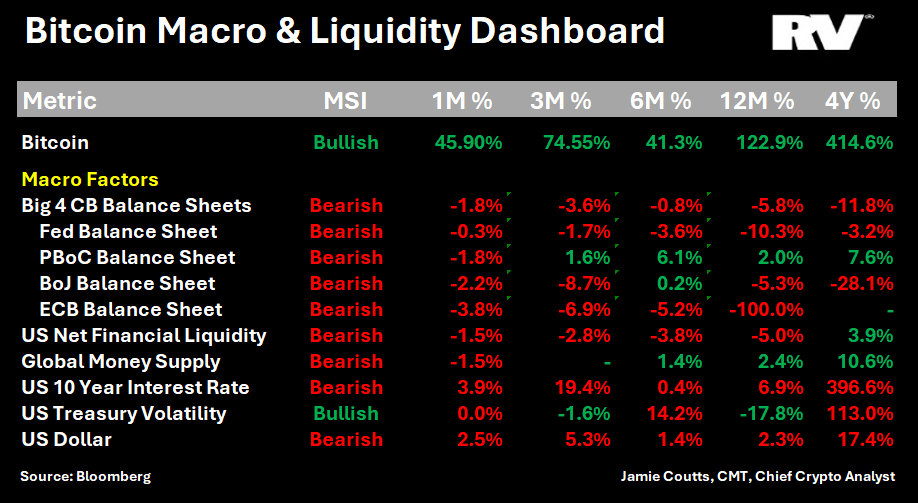
The Bitcoin monetary network, ambivalent to the machinations of central bank policy, continues to grow stronger by the day. But with macro driving the marginal buyer of all risk assets lets explore the subtle global liquidity cues which will could forewarn of a cycle low 🧵
Despite the worst macro environment in decades, #BTCs hash-rate has hit a new all-time high, demonstrating a resilience that the fiat system has been short in throughout 2022. Image
Institutions have effectively withdrawn $700b + from the financial system, preferring to park it with the Fed than risk it in the short term lending markets. This is 3x the liquidity withdrawal from the Fed via quantitative tightening. 
hat tip @CryptoHayes for this framework Image
@CryptoHayes Our regime filter captures the broad trend in US liquidity conditions (subchart). Current Bearish regime at 10mths is the 2nd most prolonged tightening and largest in magnitude with approx. $1.2T drained from the system since Dec-2022 (2x 2018/19 tightening). Image
@CryptoHayes In the last cycle, #BTC bottomed in Dec-2018, months before Fed ended QT & the liquidity regime flipped bullish. I expect something similar to play out again Image
@CryptoHayes While the regime filter wont identify exact tops/bottoms in US financial liquidity it does a solid job of identifying most optimal time for allocating to BTC/Crypto.
TL;DR - Bullish regimes have positive return skew and vice versa. Image
@CryptoHayes Lets look beyond US & add global money supply (M2) into the mix -- our custom index of the 13 of the largest economies' has contracted by 7.47% ($7T). Of the top 5, most of the tightening has come from local currencies depreciating & not M2 contraction (only US M2 is down YTD) Image
@CryptoHayes During the last cycle low, the bottom for Bitcoin formed when the global money supply index started to rise (ie M2 ⬆️ and/or USD ⬇️ ). Currently global money supply is net negative Image
@CryptoHayes Using my colleague @mikemcglone11 chart we can see a temporal relationship between Bitcoin's price relative to its own 10-month moving average (orange) and the 12-month change in global money supply (white) -- worth watching this going fwd 👀 Image
@CryptoHayes @mikemcglone11 After trading at the most extreme discount to its 10-month moving average, #BTC's price since July has found support with price momentum starting to reverse after being sharply negative all year. Image
@CryptoHayes @mikemcglone11 In previous cycles, this has been the setup for a cycle low. BTC vs its moving average reverses up approx. 1-6 months before the rate-of-change of global money supply starts its reversal. Usually before other assets - "Bitcoin is the last functioning fire alarm" @LukeGromen Image
@CryptoHayes @mikemcglone11 @LukeGromen Money Supply Momentum Improving -- assuming relationship holds, improving M2 momentum should provide a critical signal that #BTC has found a cycle low. The system we have developed to identify inflection points uses a 3 & 12-month rate-of-change crossover Image
@CryptoHayes @mikemcglone11 @LukeGromen Although the system is currently showing a signal for October, we would need to wait til the end of month for validation. If we take another leg lower, the signal will be invalidated and we will have to wait further Image
@CryptoHayes @mikemcglone11 @LukeGromen Bottom Line: With every day of CB distortion, BTC, the network & asset becomes more valuable and validated. But for timing purposes, both the US liquidity and Global Money Supply indexes should provide the necessary clues for a tradable long term low for #BTC

• • •

Missing some Tweet in this thread? You can try to force a refresh
 

Keep Current with Jamie Coutts CMT

Jamie Coutts CMT Profile picture

Stay in touch and get notified when new unrolls are available from this author!

Read all threads

This Thread may be Removed Anytime!

PDF

Twitter may remove this content at anytime! Save it as PDF for later use!

Try unrolling a thread yourself!

how to unroll video
  1. Follow @ThreadReaderApp to mention us!

  2. From a Twitter thread mention us with a keyword "unroll"
@threadreaderapp unroll

Practice here first or read more on our help page!

More from @Jamie1Coutts

May 29
#Celestia ($TIA) price action looking very positive after a big pullback the past 3months. Data Availability (DA) activity looking healthy as well.

Some quick and very under-researched thoughts on TIA price action, network demand, supply, and comparative valuation.Image
Firstly, I have not done a deep dive on TIA. So feel free to shred these thoughts with more educated takes. Here to learn.

On the technicals, I like what the absolute price chart is showing—signs of recovery and gaining momentum once again. Image
TIA was one of the few assets that performed well after their TGE. Well done - a rare feat in the unscrupulous world of crypto token launches. TIA posted a 10x return before eventually rolling over in April alongside the entire crypto market. Now its breaking out of its downtrend after a 60% pullback.Image
Read 14 tweets
May 22
Bitcoin's Collateralization Mission

I wrote a report for Pro-Crypto subs @realvision last month -- below is a🧵and for those with no patience, the TL;DR;

The global order is shifting: U.S. Treasuries lose appeal, gold re-emerges, and trillions in assets get tokenized on blockchains. Millennials and Gen Z will inherit $80T. Bitcoin’s network value grows with decentralized staking, and whilst not without risks, its feasible $BTC quickly becomes a key collateral asset in the crypto economy and symbiotically enhances PoS networks.Image
1/ Bitcoin's journey towards becoming a global reserve asset involves developing greater utility and robust collateralization use cases. Shared security and staking are key innovations driving this evolution.
2/ Shared security allows BTC holders to leverage over $1.5 trillion in economic security across other Layer 1 PoS networks for staking yields. The Babylon protocol is at the forefront of introducing Bitcoin staking. Image
Read 16 tweets
May 21
In the Dec-23 @Realvision Pro-Crypto report, I discussed strategies to outperform in the bull cycle, especially the Alt-Season phase.

Drilling into the ETH vs. BTC ratio, here is a quick technical update, including the momentum strategy for navigating the 🍌zone.

🧵 Image
ETH vs BTC
This ratio perhaps more than any other, is the most important sentiment gauge for the cycle.

At the time of the report, the ETH/BTC ratio was at an extreme 'undervalued' level (365d z-score) but trending lower. The setup was there but I prefer to use a momentum filter for a trend change. Its been 6mths and other assets have outperformed that I like ($SOL, $NEAR) and so that was the right decision.Image
ETH vs BTC
The increasing likelihood of an ETH ETF has changed momentum and we are entering what some (@RaoulGMI) have referred to as "some kind of fruit" zone 🍌🍌🍌 Image
Read 8 tweets
Apr 12
While #Solana's outperformance has waned in the past month, it is still the best-performing network in the past 12–18 months by a country mile. Do the fundamentals justify the outperformance, or is it just a result of market hype and speculation?
🧵on Solana's network health and frameworks for valuing #blockchain assets.
While narratives and information asymmetry still have primacy in #crypto markets, the nascent field of blockchain fundamentals provides investors with a framework to cut through some of the noise and evaluate asset performance and relative valuation within the ecosystem.
Network Value:

🔍While the price is 35% below 2021 peak, the market cap has already reached new ATHs this cycle. This is important when we start to look at valuation metrics for the asset on a standalone basis and vs. history. Image
Read 18 tweets
Apr 5
#Bitcoin is facing some macro headwinds, with several indicators in my macro state regime model turning negative in recent weeks. However, the longer term liquidity cycle remains extremely favorable for $BTC and #crypto in general.

Lets dive in 🧵 Image
Over the past several weeks, most of the macro/ liquidity-related factors relevant to the Bitcoin price have turned lower.

Some of these factors are more important than others. Image
From my backtesting and analysis, the big 3 to watch are CB balance sheets, the global money supply, and the dollar. My momentum models are generally medium term (several months) vs long term (12-mths+).

While there are instances when $BTC goes up when these factors are bearish, over most timeframes, negative returns are associated with periods when these factors are bearish.Image
Read 18 tweets
Sep 14, 2023
The #Bitcoin energy narrative is flipping! A new note out this morning on the Bloomberg Terminal looks at the rapid rise of sustainable energy sources in $BTC mining
🧵 Image
Since 2016, I have noticed the attacks on Bitcoin's energy usage intensify. I will put aside the piousness of the argument that one form of energy use is better than another (that's a thread for another time)

Image
Image
Image
Firstly, there has been a big improvement in data visibility & modelling.@DSBatten @coinmetrics @JMellerud have contributed greatly to the space, building on the initial work from the pioneer @CambridgeAltFinrefin. Hopefully we start to see less variability btw models Image
Read 16 tweets

Did Thread Reader help you today?

Support us! We are indie developers!


This site is made by just two indie developers on a laptop doing marketing, support and development! Read more about the story.

Become a Premium Member ($3/month or $30/year) and get exclusive features!

Become Premium

Don't want to be a Premium member but still want to support us?

Make a small donation by buying us coffee ($5) or help with server cost ($10)

Donate via Paypal

Or Donate anonymously using crypto!

Ethereum

0xfe58350B80634f60Fa6Dc149a72b4DFbc17D341E copy

Bitcoin

3ATGMxNzCUFzxpMCHL5sWSt4DVtS8UqXpi copy

Thank you for your support!

Follow Us!

:(