The Chartians Profile picture
Oct 14, 2022 8 tweets 5 min read Read on X
Stuck in #Adani Group stocks ?
Let's find out where the next supports are, what the charts are saying.
Retweet to amplify the reach ⚡️♥️

1. #ADANIWILMAR [AWL]⚡️
Important support at 650 below this can see 600 and even 550.
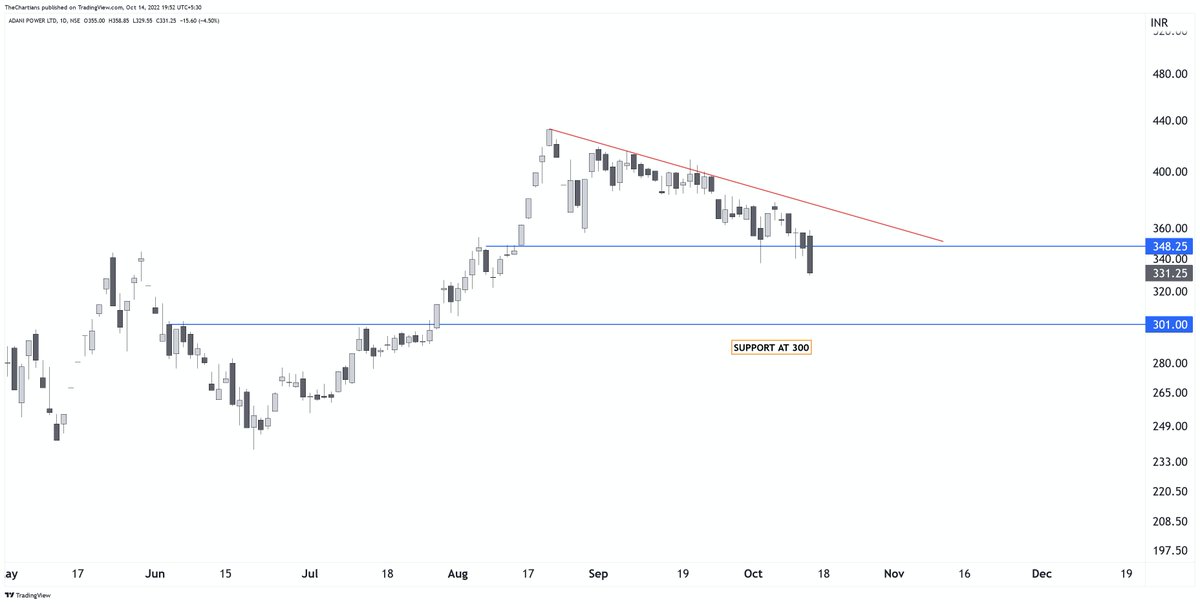
 Image
2. #ADANIPOWER ⚡️
More pain left next support at 300 for Adanipower now. Bullish only if starts closing above 350. Image
3. #ADANIENT ⚡️
Strongest of them all, charts saying stock stuck in a range. Support zones at 3060-3000. Resistance at 3450. Image
4. #ADANIGREEN ⚡️
Charts looking weak trading below important support of 2050. Can take it to 1700 levels too.

Strong only above 2060. Image
5. #ADANIPORTS ⚡️
Immediate support looks at 660. No support before that if on Monday starts trading below yesterday's low consider 660 coming soon!
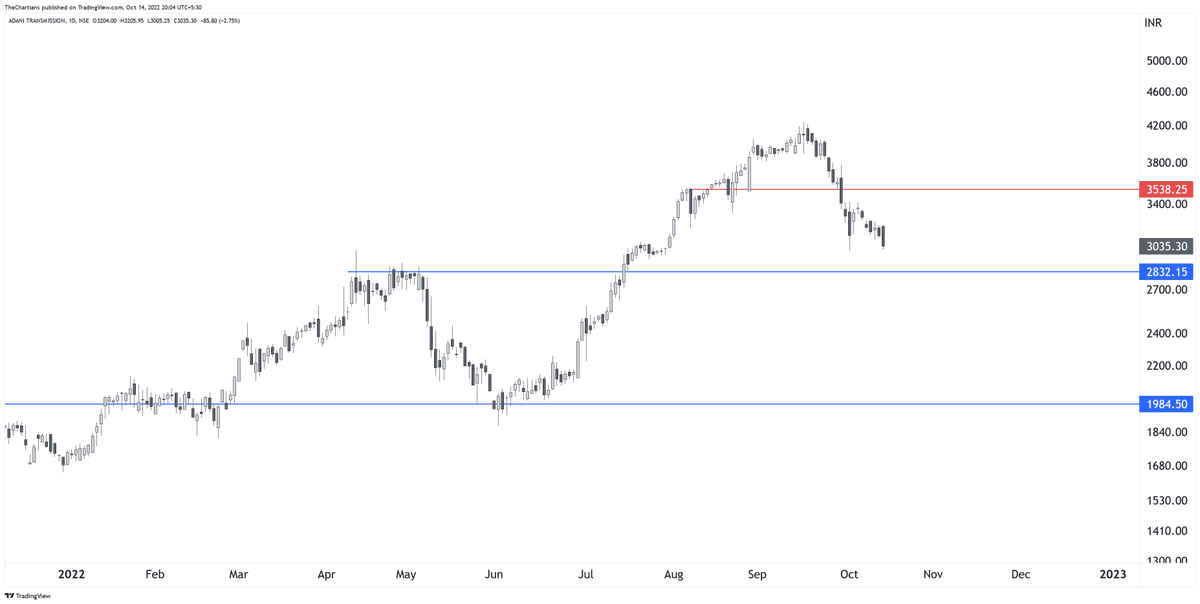
 Image
6. #ADANITRANS ⚡️
Another stock that seem to be coming for retest now .
Support at 2830-2800 for this.

Major support 2730. If break this Short term Trend changes to bearish for this stock. Image
7. #ATGL [ADANI TOTAL GAS ] ⚡️
Another stock that is looking weak, 1st Supports seen at 2850 , next at 2620-2600.

Strong only above 3300 Image
Hope, this makes things clearer for you guys, like and retweet, share with your friends who are panicking and stuck in #Adani Group stocks.

You guys can join our Free Telegram channel for more such clean charts | telegram.me/chartians

• • •

Missing some Tweet in this thread? You can try to force a refresh
 

Keep Current with The Chartians

The Chartians Profile picture

Stay in touch and get notified when new unrolls are available from this author!

Read all threads

This Thread may be Removed Anytime!

PDF

Twitter may remove this content at anytime! Save it as PDF for later use!

Try unrolling a thread yourself!

how to unroll video
  1. Follow @ThreadReaderApp to mention us!

  2. From a Twitter thread mention us with a keyword "unroll"
@threadreaderapp unroll

Practice here first or read more on our help page!

More from @chartians

Jun 15
"Chart your success Trading Course by @chartians

Chapter 1 : Dow Theory 📈📊
1️⃣ History of Dow Theory

- Origin: Charles Dow, co-founder of the Wall Street Journal and Dow Jones & Company, formulated Dow Theory in the late 19th century.

- Development: Dow's theory was based on his editorials in the Wall Street Journal where he analyzed the behavior of the stock market.

- Significance: This theory is the cornerstone of technical analysis, providing a systematic approach to understanding market trends and behaviors. It laid the groundwork for many other technical analysis theories.Image
2️⃣ Basic Principles of Dow Theory

- Market Discounts Everything: All available information, including news, earnings reports, and even future expectations, is already reflected in stock prices. Therefore, analyzing price movements alone can provide insights into market behavior.

- Three Trends:
- Primary Trends: Major movements lasting from months to years. They represent the overarching direction of the market.
- Secondary Trends: Intermediate corrections or reactions against the primary trend, lasting from weeks to a few months. They are often seen as pullbacks in an uptrend or rallies in a downtrend.
- Minor Trends: Short-term fluctuations lasting from days to a few weeks, often seen as noise within the larger trends.

- Trends Have Three Phases:
- Accumulation Phase: Informed investors start buying or selling stock against the prevailing trend.
- Public Participation Phase: The broader market catches on, and price movements become more pronounced.
- Distribution Phase: Informed investors begin to sell off their holdings to the less informed public, typically marking the end of the trend.

- Confirmation and Volume: A trend must be confirmed by price movements across major market indices and should be supported by trading volume.

- Trends Continue Until a Clear Reversal: Market trends are expected to persist until definitive signals indicate a reversal, even amidst temporary fluctuations.Image
Read 9 tweets
Apr 21
8 BULLISH BREAKOUTS FOR COMING DAYS 📈⭐️

1. #Trent 4158

1/8

For trades : telegram.me/chartians
Image
2. #Prestige 1231

2/8 Image
3. #Natcopharma 999

3/8 Image
Read 9 tweets
Feb 7
Google sheets is used by almost 99% people in the world 🌎

Most people don’t know how to use it for TRADING and INVESTING purposes 📖

10 features everyone should know :
How you can use some secret features of Google Sheet and Google Finance in your trading together?

5 things that a trader should know and implement:
GOOGLEFINANCE(ticker, [attribute], [start_date], [end_date|num_days], [interval])

Above function is a basic one.

Let's decode each parameter in this:
1. Ticker: This is the symbol of the stock.

"NSE: RELIANCE" is the ticker for Reliance Industries Image
Read 13 tweets
Feb 3
99% of traders rely on some kind of indicator to back their conviction.

It's not bad to use indicators. However, before applying them, a trader should understand how these indicators are derived or calculated.

Here are 10 widely used indicators by traders and institutions: 👇🏼👇🏼 Image
This thread is in collaboration
@OmkarBanne

He is a fellow trader and all credits to this thread goes to him. Image
1. Moving Averages

- Calculates the average price of a stock over a specified period of time & helps traders identify trends and support/resistance levels

- Most commonly used MAs are 10, 21, 50, 100, 200 Image
Read 22 tweets
Jan 31
13 Stock Chart Patterns that You should know 📈💹

A thread 🔗💬
On a very basic level, stock chart patterns are a way of viewing a series of price actions that occur during a stock trading period. It can be over any time frame – monthly, weekly, daily, and intra-day.
If you can learn to recognize these patterns early, they will help you to gain a real competitive advantage in the markets. Just as technical indicators can help your technical analysis trading, stock chart patterns can contribute to identifying trend reversals and continuations. Image
Read 17 tweets
Jan 27
#Darvas Box is used by 99.99% of stock traders in the world.

It is the simplest strategy of buy and hold.

But most people still don't know how to use it.

Here are 10 basics everyone should know:
Darvas Box is named after Nicolas Darvas, a dancer, and self-taught investor.

He discovered "Box Theory" after gaining experience from the market and he believed that the shares which move up and down the chart move in a specific box pattern.
There are some conditions of using Darvas Box and we will discuss only the buy strategy:

⚡️ Stock should be trading near all-time high levels
⚡️ Fundamentals of the company should be good
⚡️ Volumes play a crucial role

Prefer to use it daily time frame and above.
Read 11 tweets

Did Thread Reader help you today?

Support us! We are indie developers!


This site is made by just two indie developers on a laptop doing marketing, support and development! Read more about the story.

Become a Premium Member ($3/month or $30/year) and get exclusive features!

Become Premium

Don't want to be a Premium member but still want to support us?

Make a small donation by buying us coffee ($5) or help with server cost ($10)

Donate via Paypal

Or Donate anonymously using crypto!

Ethereum

0xfe58350B80634f60Fa6Dc149a72b4DFbc17D341E copy

Bitcoin

3ATGMxNzCUFzxpMCHL5sWSt4DVtS8UqXpi copy

Thank you for your support!

Follow Us!

:(