Stuck in #Adani Group stocks ?
Let's find out where the next supports are, what the charts are saying.
Retweet to amplify the reach ⚡️♥️
1. #ADANIWILMAR [AWL]⚡️
Important support at 650 below this can see 600 and even 550.
Let's find out where the next supports are, what the charts are saying.
Retweet to amplify the reach ⚡️♥️
1. #ADANIWILMAR [AWL]⚡️
Important support at 650 below this can see 600 and even 550.

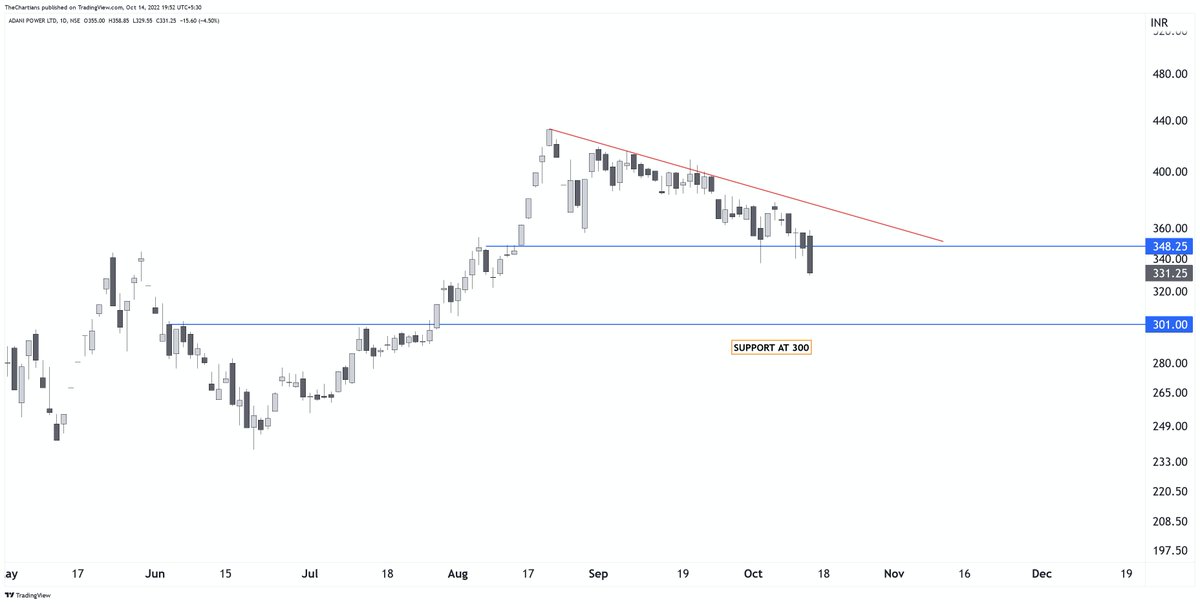
2. #ADANIPOWER ⚡️
More pain left next support at 300 for Adanipower now. Bullish only if starts closing above 350.
More pain left next support at 300 for Adanipower now. Bullish only if starts closing above 350.

3. #ADANIENT ⚡️
Strongest of them all, charts saying stock stuck in a range. Support zones at 3060-3000. Resistance at 3450.
Strongest of them all, charts saying stock stuck in a range. Support zones at 3060-3000. Resistance at 3450.

4. #ADANIGREEN ⚡️
Charts looking weak trading below important support of 2050. Can take it to 1700 levels too.
Strong only above 2060.
Charts looking weak trading below important support of 2050. Can take it to 1700 levels too.
Strong only above 2060.

5. #ADANIPORTS ⚡️
Immediate support looks at 660. No support before that if on Monday starts trading below yesterday's low consider 660 coming soon!
Immediate support looks at 660. No support before that if on Monday starts trading below yesterday's low consider 660 coming soon!

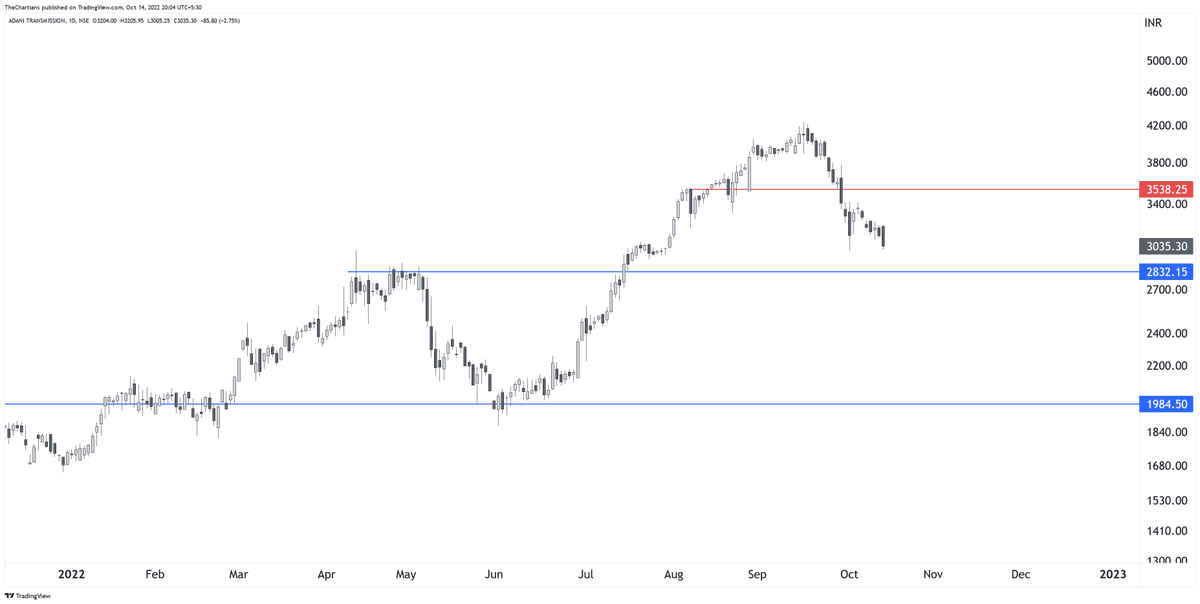
6. #ADANITRANS ⚡️
Another stock that seem to be coming for retest now .
Support at 2830-2800 for this.
Major support 2730. If break this Short term Trend changes to bearish for this stock.
Another stock that seem to be coming for retest now .
Support at 2830-2800 for this.
Major support 2730. If break this Short term Trend changes to bearish for this stock.

7. #ATGL [ADANI TOTAL GAS ] ⚡️
Another stock that is looking weak, 1st Supports seen at 2850 , next at 2620-2600.
Strong only above 3300
Another stock that is looking weak, 1st Supports seen at 2850 , next at 2620-2600.
Strong only above 3300

Hope, this makes things clearer for you guys, like and retweet, share with your friends who are panicking and stuck in #Adani Group stocks.
You guys can join our Free Telegram channel for more such clean charts | telegram.me/chartians
You guys can join our Free Telegram channel for more such clean charts | telegram.me/chartians
• • •
Missing some Tweet in this thread? You can try to
force a refresh


